Upcoming Microsoft Sentinel features
Microsoft summarized their RSAC 2026 Sentinel announcements and there’s a lot in there to digest. If you are a part of the Security Advisors Program (previously known as Customer Connection Program or CCP) you’ll most likely have tested these features in private preview. I highly recommend joining the program, as you get to test and improve a lot of features before they arrive.
That being said, having spent a few years now working in the industry I know there’s a fair distance between test environments and demos all the way up to having something working in production environments. So I’m usually a bit skeptic and I rarely recommend anything without having had some time to test and be hands-on with the feature myself.
Now, since I’m a lazy person I’m not going to cover all of the recent announcements. Instead, I’ve done like Buzzfeed and made a “here’s the three things I actually care about” list, why they matter, and some live testing to see if they hold up.
1. Connector Builder Agent in VS Code
From the announcement:
“Build Sentinel data connectors in minutes instead of weeks using the AI‑assisted Connector Builder agent in Visual Studio Code.”
If you’ve followed this blog you know I’ve spent an unreasonable amount of time on data connectors. From the original misp2sentinel Azure Function setup, to the rustymisp2sentinel adventure, to building custom DCRs from analytic rules, threat modelling log sources, detection engineering and more - data and log has always been one of the things I’ve spent the most time on.
The Codeless Connector Framework (CCF) has been around for a while and is the recommended approach for new connectors. Worth noting that the current CCF is actually the second generation. The original was announced in January 2022 and has since been superseded. The new version brought better support for authentication and pagination types, standard DCR support, and separated the UI from the connection configuration (which means you can now have multiple connections per connector). The legacy version is no longer recommended.
It’s serverless, comes with health monitoring, and you don’t pay for compute - only for the data that comes in. The problem? Building one still requires you to stitch together four separate JSON components (output table, DCR, UI definition, connection rules) into an ARM template. It’s not hard, but it’s tedious enough that most people default to an Azure Function or Logic App instead.
The connector builder agent changes this by having an AI agent in VS Code guide you (in essence it just does everything for you) through the entire process of generating schemas, deployment assets, connector UI, secret handling, and polling logic. Built-in validation catches issues before deployment.
The example prompt from the announcement is:
@sentinel-connector-builder Create a new connector for OpenAI audit logs using https://api.openai.com/v1/organization/audit_logs
Now I’ve been spending some time recently building connectors using the CCF. My setup has been pretty simple using Github Copilot with Claude Opus 4.6, a simple but strict agent-instructions.md-file and the API-reference of whatever I’m trying to build.
The instructions file is simply to make sure we are following a set of principles by capturing only relevant data (for privacy and monetary reasons), align with existing schema best-practice, ingest only unique events (first try I ingested the same event over 80.000 times which burned through most of my Azure Visual Studio Subscription almost instantly). I’m curious to see how this new agent stacks up against my slightly more jerry-rigged setup.
Live test: UpCloud Audit Logs connector
I have been testing running some infrastructure on UpCloud lately. They are a Nordic cloud provider with an audit log API that returns a chronological record of account events - logins, server actions, storage changes, database operations. Just what we need to test a little bit.
Prerequisites
You’ll need:
- The Microsoft Sentinel VS Code extension (I’m using the pre-release version)
- An UpCloud account with API credentials
- A Microsoft Sentinel workspace
Step 1: Prompt the connector builder
Open the Copilot chat in VS Code and use the connector builder agent:
@sentinel /create-connector Create a new connector for UpCloud audit logs using https://developers.upcloud.com/1.3/22-audit-logs/Now if you’re sharp you’ll see that this @sentinel /create-connector-syntax deviates from what is outlined in the RSAC announcement blog where they used @sentinel-connector-builder. It might be that I’m using the wrong version of this tool, but I’m pretty sure it will be close to the same.
Now, there are some issues here.
Caveat: this might not be the final version, so bear with me.
Every time the agent prompts for user input, everything breaks and you’ll never get back to where you were. So the modified prompt in order to bypass every single error I met is:
@sentinel /create-connector Create a new connector for UpCloud audit logs using https://developers.upcloud.com/1.3/22-audit-logs/ - use api key/bearer token. Then proceed with the newest, most best-practice aligned options if there are any more questions. If you require user input, use best effort or fill out a dummy value, as any user input causes the agent to error out.The agent should analyze the API docs and start generating based on a preset list of steps:
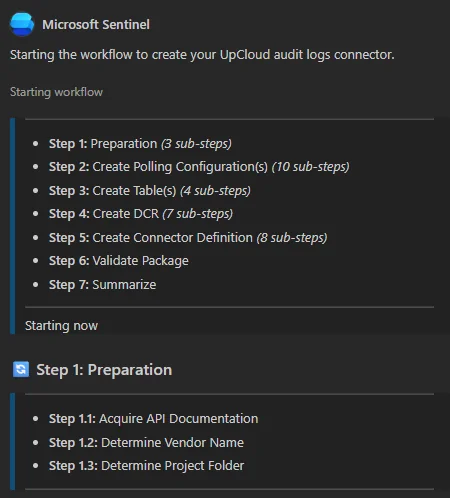
It appears to be working since it starts gathering information from the provided URI asap:
I’ve successfully gathered comprehensive documentation for the UpCloud Audit Logs API. Here’s what I found:
- Audit Logs API docs: Full endpoint documentation with request/response schemas, pagination, and filter options
- Authentication: HTTP Bearer (API token) or HTTP Basic Auth against https://api.upcloud.com/1.3/
- Response fields: time, auth_type, upcloud_correlation_id, resource_type, action, origin, account_username, ip_address, resource_id
- No OpenAPI spec file found — UpCloud doesn’t publish a machine-readable spec, but the human-readable docs are thorough
After a while, it finishes its job:
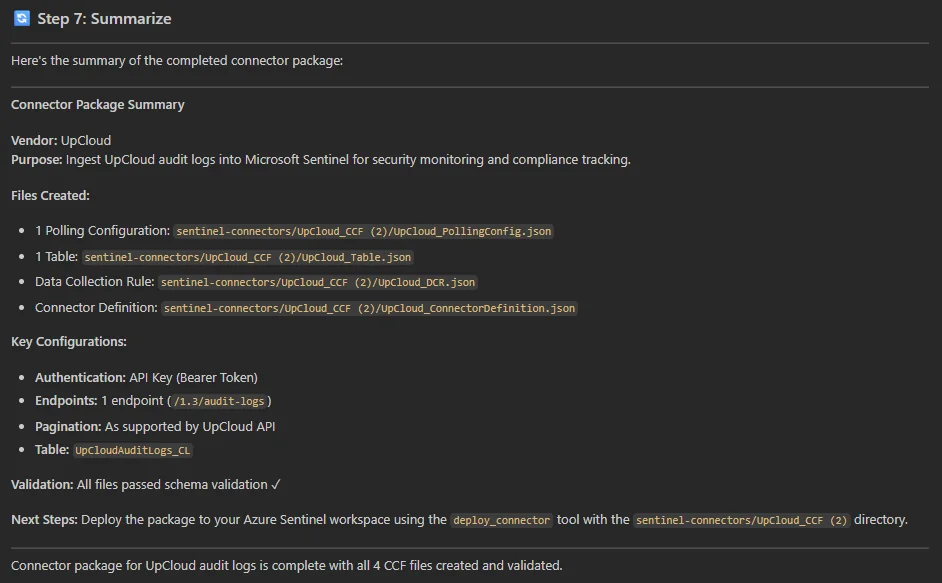
Step 2: Review what it generates
This is the part where you don’t blindly trust the output. Some things to verify:
- Authentication: UpCloud uses HTTP Basic Auth and API/Bearer Token Auth. The CCF supports both natively, so the agent should ask you for input, which it does.
- Pagination: The API uses
limit/offsetwith aUpcloud-Total-Countresponse header. Verify the agent picks this up correctly and generates the right pagination config. - Incremental polling: The
created_afterparameter should be used to avoid re-fetching old events. Check that the agent uses the last event timestamp as the cursor. - Response path: The audit logs sit under the
audit_logskey in the response. The DCR needs to point at the right response path.
Step 3: Validate and deploy
The connector builder has built-in validation which it will run automatically. If you can, also provide some sample event logs from the API before deploying - the agent should be able to validate your schema against actual data provided you provide it as part of the prompt.
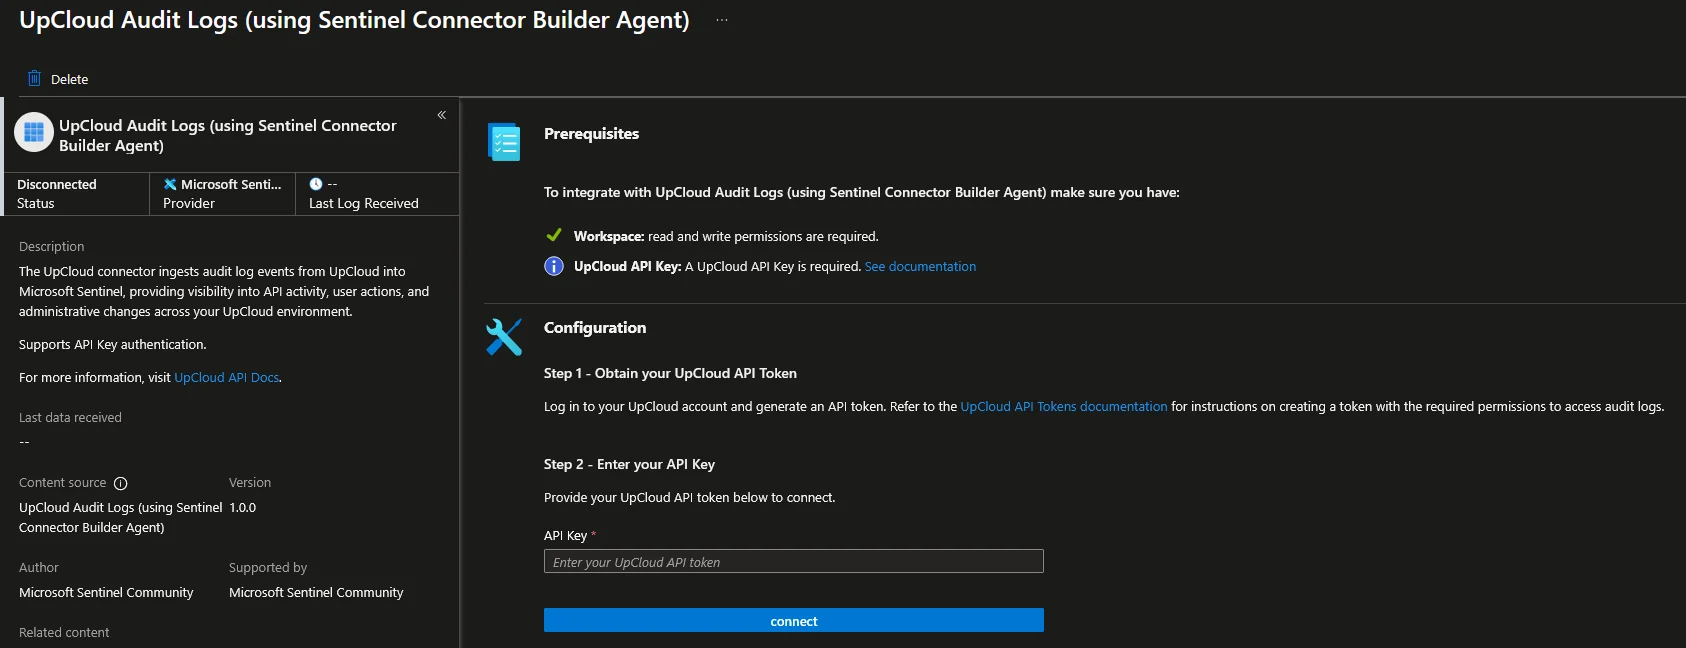
I’m now able to click deploy from the chat, which after a sign-in takes you to this overview:
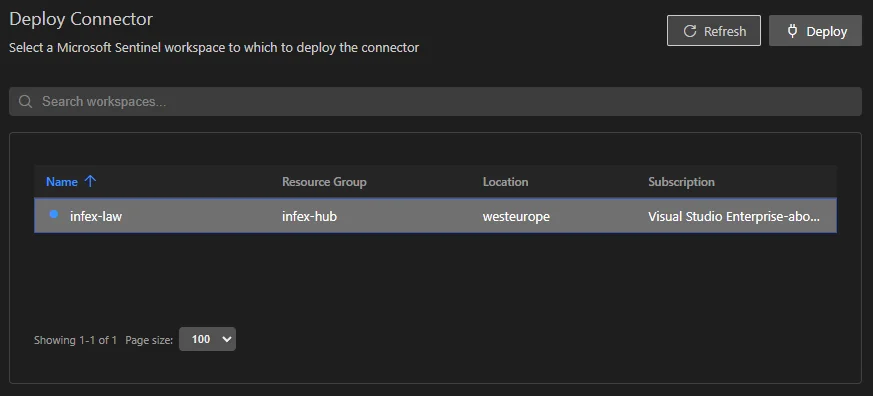
It runs and I’m a happy camper:
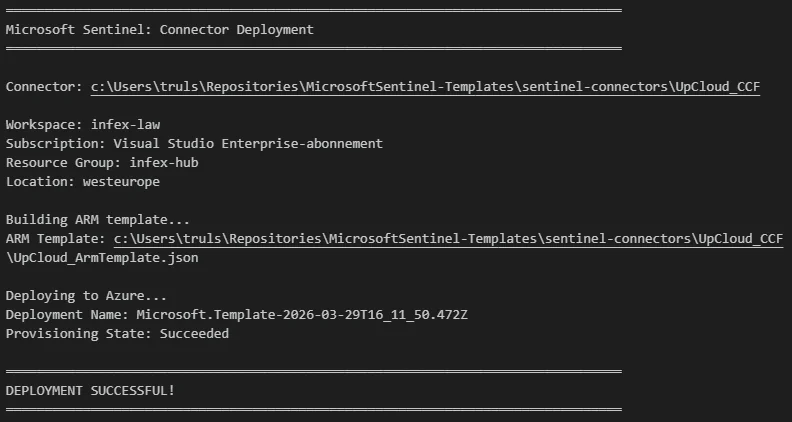
In Microsoft Sentinel it looks like this:
All in all, thus far it’s been a relatively easy experience once you got around the bugs of failing out every time you are prompted for user input.
Step 4: Connect and verify
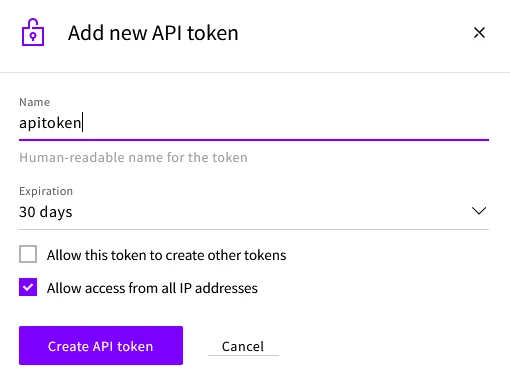
Based on the view of our UpCloud connector above we simply need to do as advertised and provide API credentials. Heading over to upcloud.com to sign up for a free trial, and then over to https://hub.upcloud.com/account/api-tokens to create my API token:
Pasting this into the connector blade and pressing connect should yield success:
After a few minutes you should see data flowing into the UpCloudAuditLogs_CL table.
UpCloudAuditLogs_CL
| take 10
And there we go:

It also returns account username, IP and more relevant information that I chose to leave out. This shows that I created an auth token and a managed object storage.
So what’s the verdict? Close, but it could be a bit better. I think this also has to do with input. Providing the API specs is one thing, but providing real examples (redacted of course) would likely make the logs a bit better. The built-in audit log in the UpCloud portal provides a lot more detail, and the API simply doesn’t have the same level of detail which of course contributes.
When looking over the real examples, the API returns two fields not in the docs, namely cloud_event_id and resource_sub_type. I have updated the example used above and pushed it to my MicrosoftSentinel-Templates repository if anyone wants to use it.
What to watch out for
A few things that might trip you up based on my experience with CCF connectors:
- Rate limiting - the UpCloud API doesn’t document explicit rate limits for audit logs, but be conservative with your polling interval. Start with 5 minutes.
- Data retention - UpCloud only keeps 180 days. Your first pull might be large if the account is active.
- Field mapping - The
timefield in the API should map toTimeGeneratedin your DCR transformation. If the agent doesn’t do this automatically, add it to the KQL transform.
2. Data Filtering and Splitting
From the announcement:
“Define simple KQL‑based transformations directly in the UI to filter low‑value events and intelligently route data.”
I created something similar back in 2022 when I wrote about creating smart DCRs from analytic rules. The idea was simple enough, if you only have analytic rules that use 20 out of 100 event IDs, why ingest the other 80?
Who needs to think about potential breaches? Minimize cloud spend, maximize risk. That’s a joke. Ish. The point is I built a PowerShell script that parses all your analytic rules, extracts the referenced event IDs, and generates XPath queries for your DCRs. The drawbacks of this are quite clear. You had to manage it yourself and run it periodically (could adapt it to a pipeline if you wanted).
Now we get filtering and splitting built directly into the Defender portal UI:
- Filtering: Remove low-value or benign events before they hit the analytics tier using KQL. No more paying to ingest events you’ll never query.
- Splitting: Route data between the analytics tier and the data lake tier based on relevance. High-signal data stays in analytics for real-time detection, lower-signal data goes to the data lake for hunting and long-term retention at reduced cost.
If you’ve ever tried to filter data in DCRs or Workspace Transform DCRs you know the pain that experience brings. Before jumping in to test this, I’m hopeful this built in filtering and splitting gets us a bit closer to something like Cribl Stream in functionality and usability.
Live test: Pick a noisy data source
I’m using some built-in data sources for testing filtering and splitting, just because I’m lazy. You’ll need to enable the relevant connector first if you haven’t already to follow along, or you can try for yourself on a custom, noisy log.
How to test it
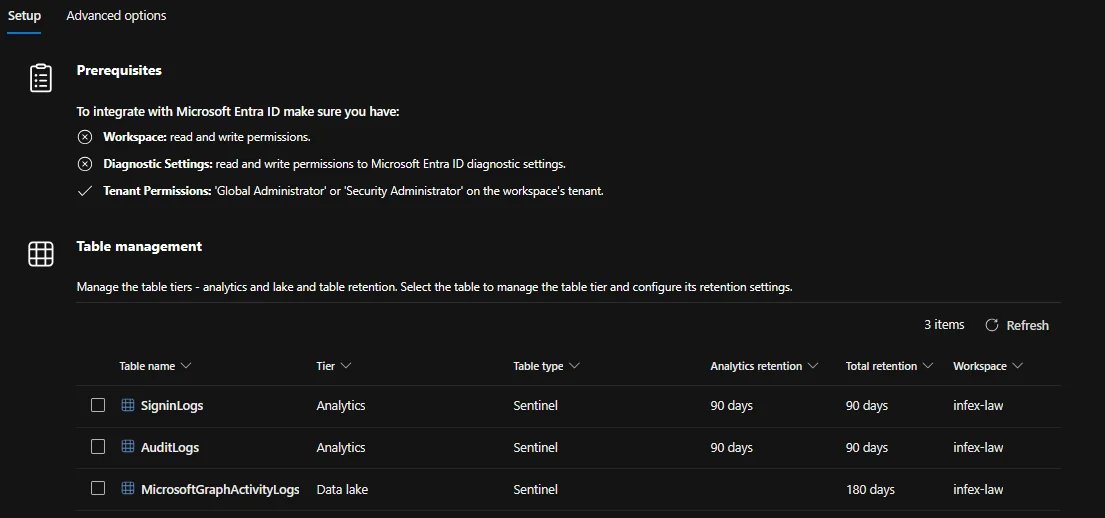
- Navigate to Microsoft Sentinel > Configuration > Data connectors in the Defender portal
- Select a connector that supports filtering/splitting like Microsoft Entra ID
- Under the table management, you can either choose to add a split rule or a filter rule
Note: At the time of writing this feature is in public preview (March 30, 2026). The exact UI flow might change.
Split and conquer using the SigninLogs-table as an example
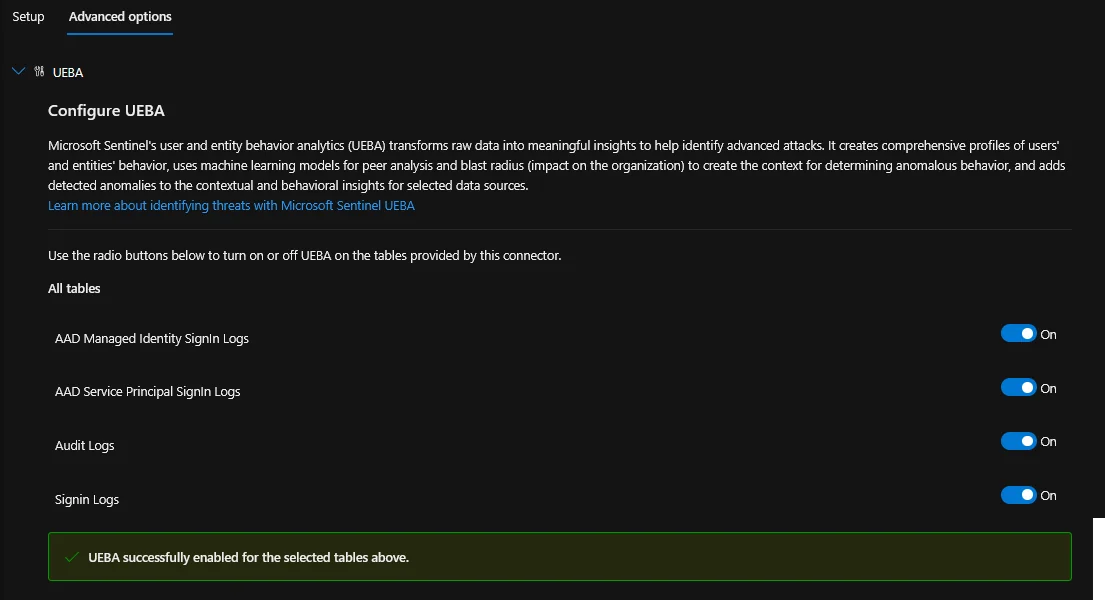
For my test, I’m going to do the SigninLogs-table. Navigating to the Entra ID data connector in Defender, can we just take a moment to talk about how far this experience has come?
The configuration is quite neat, and you can change advanced options such as UEBA directly in the data connector blade!
Anyway, moving to our SigninLogs we can choose to either split (or steal) or filter:
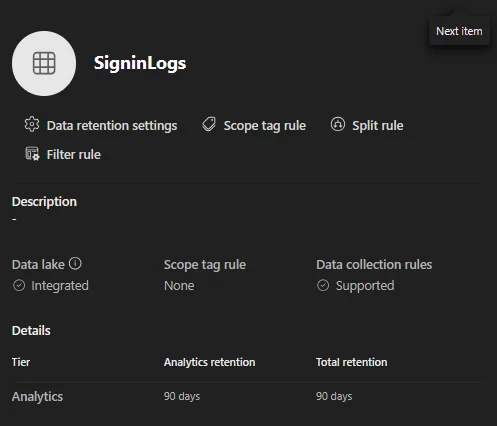
I want to try both, starting with splitting, the text in the GUI tells us what we need to know:
Only data that matches this rule will be stored in the analytics tier. All other data will be stored in the data lake. Learn more about transformations.
In essence, this works like a filter. We must specify what relevant data we want to keep. So to keep only the important sign-in events in the analytics tier and send everything else to the data lake, the intent is:
source | where ResultType != '0' or AppDisplayName == 'Azure Portal' or AppDisplayName == 'Microsoft Admin Center'Now this does not work at all. Simply providing source does not yield anything either, but a bit of experimenting reveals that source | where is implicit. So a query like ResultType != '0' works fine.
Note: The portal implicitly prepends
source | whereto whatever you enter in the TransformKql field. Submitting a full query likesource | where ResultType != '0'double-applies the prefix and breaks the parser with aKQL syntax error. It’s not documented anywhere I could find.
With this knowledge in mind, we simply provide ResultType != '0' or AppDisplayName == 'Azure Portal' or AppDisplayName == 'Microsoft Admin Center' as the query with the source | where removed.
I’m pretty sure this will be properly documented later.
One thing that annoys me a bit is that you can name the rule, but I’m not sure whether there can be more than one split rule, and I can’t see or modify the existing ones. Something to improve.
Filtering out some noise
Filter rules work in much the same way in terms of targetting, but they will filter out anything that’s hit by the rule and you can have multiple KQL conditionals. For both splitting and filtering I really wish they had a better query builder that allowed you to build the transform using the schema of the current table. Other solutions do this very well.
Selecting a table from the Configuration\Tables menu, then selecting Filter Rule opens the filter menu behind the Table flyout. Tiny bit annoying.
3. Sentinel MCP updates
I wrote about Sentinel MCP back in December when I was experimenting with building a detection engineering assistant. At that point we had the data exploration and triage tools, plus early graph preview.
Entity Analyzer is GA (since April 1)
Entity analyzer provides out-of-the-box risk assessments for URLs and user identities. It analyzes data across threat intelligence, prevalence, and organizational context to generate explainable verdicts. This is what the Defender Triage Agent uses under the hood.
It’s available through MCP, so you can integrate it into any agent you’ve built. If you followed my detection engineering assistant setup, this slots right in as a tool your agent can call to assess whether an entity it encounters during investigation is suspicious.
It is worth noting that entity analyzer is billed since April 1 based on Security Compute Units (SCU). So test it, understand the cost, then decide. Learn more about MCP billing.
Graph Tool Collection coming to Public Preview by April 20
Graph tools let you visualize and explore relationships between identities, devices, threats, and activity signals through MCP. You can query blast radius, path discovery, and exposure perimeter. This is graph-powered investigation exposed to agents.
Combined with the custom graphs that also went public preview, this means you can build tailored security graphs from your data lake and then expose them to agents via MCP. The investigation possibilities here are interesting, but I need to work with it on some real data before commenting more on it.
Claude MCP Connector is in Public Preview
Anthropic Claude gets a native MCP connector to Sentinel. You configure a custom connector in Claude that securely connects to a Sentinel MCP server, and then you can summarize incidents, investigate alerts, and analyze security data. All the data stays within Microsoft’s security boundary.
Live test: Add Entity Analyzer to your MCP setup
If you already have the Sentinel MCP server configured in VS Code (see my earlier post for the full setup), the entity analyzer tool should appear in your tool collection. Keep in mind that billing has been active since GA on April 1.
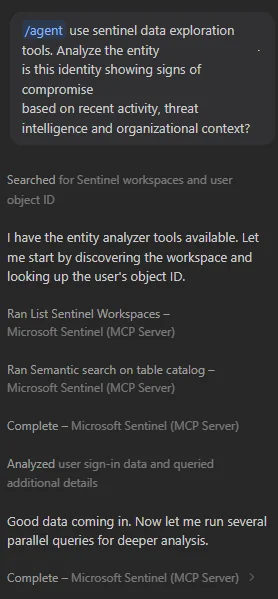
Test it by asking your agent to analyze a suspicious URL or user:
Analyze the entity user@infernux.no - is this identity showing signs of compromise
based on recent activity, threat intelligence and organizational context?
And it starts working, requiring some user approvals before starting it’s analysis:
The MCP server will call the entity analyzer, which returns a structured risk assessment with:
- A verdict (malicious/suspicious/benign)
- Contributing signals (TI matches, anomalous behavior, prevalence)
- Confidence level
It outlines a summary, featuring a matrix with findings and a short conclusion:
This identity shows no signs of compromise. The X outlier is the only anomaly worth noting and is most consistent with travel or a conference visit. If you want to strengthen posture, the unmanaged/non-compliant device on that Y session and the notApplied Conditional Access status suggest a CA policy gap for non-Z locations.It works rather well, as it checks sign-in logs, cross-references TI feeds, looks at behavior analytics all quite quickly. The point isn’t that it replaces your analysis, but that it gives you a better situational awareness faster.
What do I think?
The connector builder agent is the most important announcement for me. Not because AI-generated connectors are all the rage, but because the process of building a CCF connector has enough wonk (four JSON components, ARM template, DCR, table definition) that most people never bother with it. They’ll stand up a Logic App or Azure Function instead, both of which cost more and require more maintenance. If the connector builder agent gets the output right 80% of the time and you just need to review and tweak, that’s a massive improvement in my books.
Filtering and splitting is overdue but welcome. Having it built into the Defender portal with a proper UI is the right call. The real power is in the splitting, being able to dual-home logs and route verbose data to the data lake and keep high-signal data in the analytics tier without building custom pipelines. This is how you manage cost at scale without sacrificing coverage. Is it perfect or close to it? No, it’s still lacking in usability. Only having the option to supply a transform KQL using source and filtering raises the bar for who can use it. A proper transform creator based on the schema of the log would be a huge upgrade.
The MCP expansion is going in the right direction. Ever the AI sceptic I have to admit the graph tools are promising. I don’t have much more to add at the moment, I will have to play more with it to see.