Microsoft Sentinel Usage Table Plan Field: KQL Queries for Cost Analysis
Quick info
Microsoft has now enabled the Plan field in the Usage table. That means the hourly usage records in Log Analytics can be split directly by table plan, which finally makes it easier to work with Analytics, Basic, and Auxiliary data in native KQL.
This closes a small but annoying gap. Now the Usage table reference documents Plan directly, and that removes the need for extra enrichment when you want to understand how your ingestion is distributed.
If you work with Sentinel cost reviews, table tuning, or workbooks, this is immediately useful. The Usage table is already aggregated hourly, and Quantity is recorded in megabytes, so it is a good fit for day, week, and month level rollups.
Credit where due: I first noticed this update through a LinkedIn post from Sandor Tokesi.
Queries
All examples below use Usage, filter to billable records, and convert Quantity from MB to GB.
Daily ingestion split by plan
This is a modified version of a query I have posted about previously. It’s not rocket science, but everyone should have this in their saved notes - here I have simply swapped in Plan in the summarize-line instead of DataType. Now it shows how much data lands in each plan per day.
Usage
| where TimeGenerated >= startofday(ago(30d))
| where IsBillable == true
| summarize IngestedGB = round(sum(Quantity) / 1000.0, 2) by bin(StartTime, 1d), Plan
| order by StartTime asc
| render timechart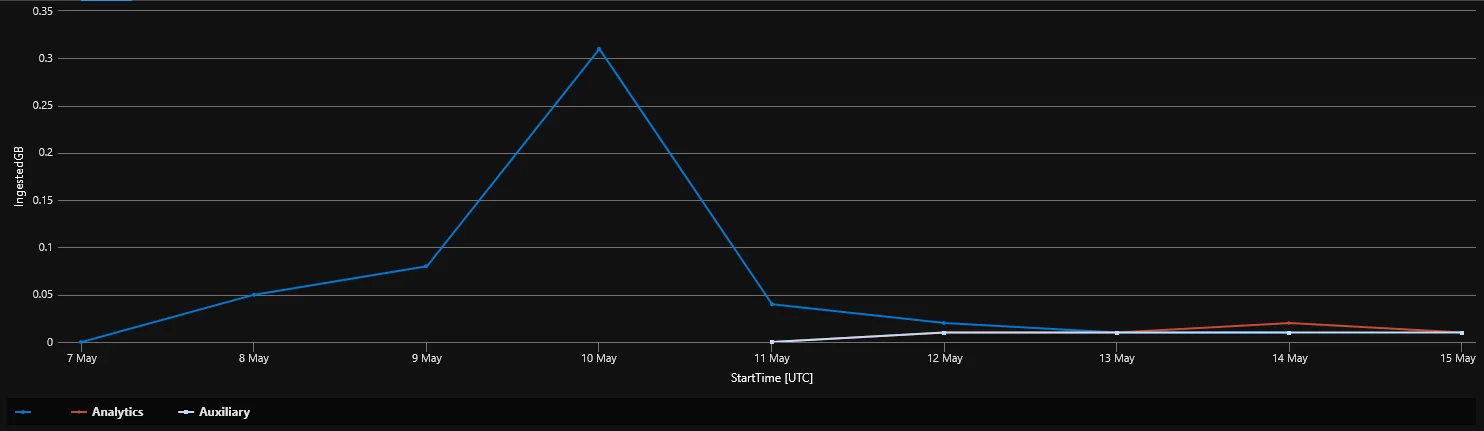
Top tables by volume and plan
If you want to find the tables driving ingestion, this gives you a straightforward top list.
Usage
| where TimeGenerated >= ago(30d)
| where IsBillable == true
| summarize IngestedGB = round(sum(Quantity) / 1000.0, 2) by DataType, Plan
| top 20 by IngestedGB desc
| order by IngestedGB desc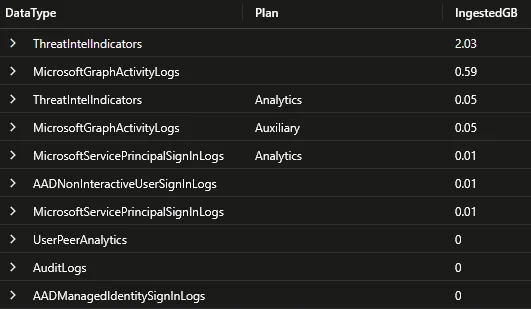
Plan distribution over the selected period
Useful when you want a quick ratio view of how much of your ingestion sits in Analytics versus Basic or Auxiliary.
let usageByPlan =
    Usage
    | where TimeGenerated >= ago(30d)
    | where IsBillable == true
    | where isnotempty(Plan)
    | summarize IngestedGB = sum(Quantity) / 1000.0 by Plan;
let totalGB = toscalar(usageByPlan | summarize sum(IngestedGB));
usageByPlan
| extend IngestedGB = round(IngestedGB, 2)
| extend Percent = round((IngestedGB / totalGB) * 100.0, 2)
| order by IngestedGB desc
| render piechart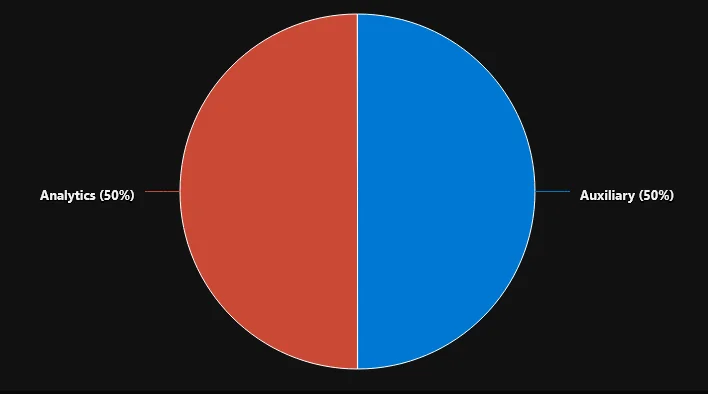
Tables that have used more than one plan
This is handy after table plan changes. It helps you find tables that have usage recorded under multiple plans during the period you are reviewing.
Usage
| where TimeGenerated >= ago(30d)
| where IsBillable == true
| summarize PlansSeen = make_set(Plan), IngestedGB = round(sum(Quantity) / 1000.0, 2) by DataType
| where array_length(PlansSeen) > 1
| order by IngestedGB desc
For now it will likely just show either one of Auxiliary or Analytics with the other value being an empty "".
Rough pay-as-you-go estimate by plan
If you want a quick estimate, plug in your regional prices per GB and use the output as a simple cross-check. For Analytics, keep in mind that commitment tiers and simplified Sentinel pricing can change the real number.
let AnalyticsPricePerGB = 0.0;
let BasicPricePerGB = 0.0;
let AuxiliaryPricePerGB = 0.0;
Usage
| where TimeGenerated >= startofday(ago(30d))
| where IsBillable == true
| summarize IngestedGB = sum(Quantity) / 1000.0 by Plan
| extend PricePerGB = case(
    Plan == "Analytics", AnalyticsPricePerGB,
    Plan == "Basic", BasicPricePerGB,
    Plan == "Auxiliary", AuxiliaryPricePerGB,
    real(null)
)
| extend EstimatedCost = round(IngestedGB * PricePerGB, 2)
| project Plan, IngestedGB = round(IngestedGB, 2), PricePerGB, EstimatedCost
| order by EstimatedCost desc
Log Horizon
This also affects my own tool, Log Horizon. It already resolves the current table plan from the Log Analytics tables API through Get-TableRetention.
I have now updated it to enrich Get-TableUsage with Usage.Plan, so Log Horizon can show observed ingestion split by plan, flag tables seen under more than one plan during the selected period, and compare the configured table plan with what actually showed up in Usage.
If you want the more general background on Sentinel estimation, I wrote about that earlier in Cost estimation in Microsoft Sentinel.