OpenTelemetry from coding agents to Azure Monitor
How do you get visibility into what your coding agents are actually doing - what prompts they fire, what tools they call, how long things take, how often they fail? And maybe most importantly, if any of your users are sharing company secrets like they are trying to appear on Enterprise Gossip Girl.

VS Code Copilot and Claude Code/Cowork/Office Agents all speak OpenTelemetry, which means you can pipe that data into the same Azure-side logging stack you already run for everything else (probably, hopefully).
This post will cover how OTel works (that’s what the cool kids call it, some cool kids told me). It includes one concrete pipeline I built (OTEL2Sentinel) to land the data in Application Insights / Log Analytics, and the config the sources need. It is one way to do this, not the only way - the Azure Monitor OpenTelemetry Distro and direct SDK exports are valid alternatives if your sources support them.

Or one of the ways. Only siths deal in absolutes, after all.
What OpenTelemetry actually is
OpenTelemetry (OTel) is a CNCF project that defines:
- A data model for three signals: traces, metrics, and logs.
- A wire protocol (OTLP) for moving those signals over gRPC (port
4317) or HTTP/protobuf (port4318), with the well-known path suffixes/v1/traces,/v1/metrics, and/v1/logsfor OTLP/HTTP. See the OTLP specification. - SDKs for most languages plus a Collector that can receive, process, and re-export telemetry to many backends. See Collector docs.
The usual shape is:
flowchart LR
    A[App or agent with OTel SDK] -- OTLP --> B[OTel Collector]
    B -- vendor exporter --> C[Backend: App Insights, Loki, Tempo, ...]
Sources only need to know “where do I POST OTLP, and what header do I send”, and you can swap backends, add processors (batching, filtering, attribute scrubbing) and fan out to multiple destinations without touching every source.
The pipeline
For the agent use case I wanted:
- One public OTLP endpoint the agents can reach from a laptop.
- Telemetry landing in Log Analytics so I can KQL it next to everything else.
- Azure “native” services
That ended up as a workspace-based Application Insights instance fronted by an OpenTelemetry Collector in Azure Container Apps:
flowchart LR
    A[VS Code Copilot / Claude Code] -- HTTPS --> B[Collector in Azure Container Apps]
    B -- azuremonitor exporter --> C[Application Insights]
    C --> D[Log Analytics workspace]
One minor thing to mention in this design - the network ingress option allows you to set a target port in the Container App:
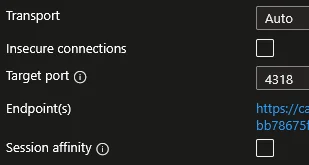
So we don’t have to specify the inbound port, we can just transfer over HTTPs and let someone else do the work.
Why these pieces:
- Workspace-based Application Insights writes through to a Log Analytics workspace. In the default logs-only config used in this repo, OTel log records land in
AppTraces. If you also enable a traces pipeline, spans map into tables such asAppDependencies/AppRequests, so you can query them next to the rest of your workspace data and write them straight to Microsoft Sentinel if you want. See Workspace-based Application Insights resources. azuremonitorexporter in the Collector Contrib distribution handles the App Insights protocol so the collector doesn’t need any custom code. See the exporter README.- Azure Container Apps gives me a public HTTPS endpoint, scale-to-1, and managed TLS without standing up AKS. See Azure Container Apps overview.
The full picture looks something like this (it’s a bit busy big sorry):
flowchart LR
    AGENT["Local coding agents"]
    direction LR
    ACR[("Azure Container Registry<br/>collector image")]

    subgraph CAE["Container Apps environment"]
        subgraph CA["Container App: otel-collector"]
            direction TB
            RCV["OTLP receivers<br/>HTTP :4318 / gRPC :4317"]
            PROC["Processors<br/>memory_limiter → resource → batch"]
            EXP_AM["Exporter: azuremonitor"]
            EXP_DBG["Exporter: debug (stdout)"]
            RCV --> PROC --> EXP_AM
            PROC --> EXP_DBG
        end
    end

    subgraph Secrets["Container App secrets"]
        S_CONN["APPLICATIONINSIGHTS_CONNECTION_STRING"]
        S_AUTH["REQUIRED_OTEL_AUTH_HEADER<br/>(not enforced today)"]
    end

    AI["Workspace-based<br/>Application Insights"]
    LAW[("Log Analytics workspace<br/>AppTraces (+ AppDependencies if traces enabled)")]
    CACL[("ContainerAppConsoleLogs_CL<br/>(platform logs)")]


    AGENT -- "OTLP/HTTP + Bearer" --> RCV

    ACR -. image pull .-> CA
    S_CONN -. env var .-> EXP_AM
    S_AUTH -. env var .-> CA

    EXP_AM --> AI --> LAW
    EXP_DBG -. stdout .-> CACL
Default mode is logs only. In the config shown here, the collector forwards log records, so session/turn/tool-call events land in AppTraces. If you also enable a traces pipeline, tool execution spans show up in AppDependencies / AppRequests.
Collector config
The whole runtime config is small enough to read in one screen:
receivers:
  otlp:
    protocols:
      grpc:
        endpoint: 0.0.0.0:4317
      http:
        endpoint: 0.0.0.0:4318

processors:
  memory_limiter:
    check_interval: 1s
    limit_mib: 512
    spike_limit_mib: 128
  batch:
    send_batch_size: 1024
    timeout: 5s
  resource:
    attributes:
      - key: deployment.environment
        value: azure-container-apps
        action: upsert

exporters:
  azuremonitor:
    connection_string: ${env:APPLICATIONINSIGHTS_CONNECTION_STRING}
  debug:
    verbosity: normal

service:
  pipelines:
    logs:
      receivers: [otlp]
      processors: [memory_limiter, resource, batch]
      exporters: [azuremonitor, debug]
The ${env:...} substitution is a Collector built-in and lets the App Insights connection string live as a Container App secret instead of being baked into the image.
Source config
Both VS Code Copilot and Claude Code follow the standard OTel env vars (OTEL_EXPORTER_OTLP_*), plus a vendor-specific toggle to actually emit anything.
VS Code Copilot (github.copilot.chat.otel.* reference):
COPILOT_OTEL_ENABLED=true
OTEL_EXPORTER_OTLP_PROTOCOL=http/protobuf
OTEL_EXPORTER_OTLP_ENDPOINT=https://<collector-fqdn>
OTEL_EXPORTER_OTLP_HEADERS=Authorization=Bearer <shared-secret>
OTEL_SERVICE_NAME=copilot-chat

# Keep content capture off unless you really want prompt/response bodies in App Insights.
COPILOT_OTEL_CAPTURE_CONTENT=false

OTEL_RESOURCE_ATTRIBUTES=deployment.environment=dev,team.id=platform
Claude Code (Monitoring usage docs):
CLAUDE_CODE_ENABLE_TELEMETRY=1
OTEL_METRICS_EXPORTER=none
OTEL_LOGS_EXPORTER=otlp
OTEL_TRACES_EXPORTER=none

OTEL_EXPORTER_OTLP_PROTOCOL=http/protobuf
OTEL_EXPORTER_OTLP_ENDPOINT=https://<collector-fqdn>
OTEL_EXPORTER_OTLP_HEADERS=Authorization=Bearer <shared-secret>

# Privacy-first defaults: no prompts, no tool args/results, no raw API bodies.
OTEL_LOG_USER_PROMPTS=0
OTEL_LOG_TOOL_DETAILS=0
OTEL_LOG_TOOL_CONTENT=0
OTEL_LOG_RAW_API_BODIES=0

OTEL_RESOURCE_ATTRIBUTES=deployment.environment=dev,team.id=platform
The OTEL_EXPORTER_OTLP_ENDPOINT is the collector’s FQDN. The agent SDKs append /v1/logs (and /v1/traces, /v1/metrics if enabled) per OTLP/HTTP spec - don’t include the path yourself.
Content capture warning
Both products have a content-capture flag that is off by default, and you should keep it off until you’ve thought about where the data ends up:
- VS Code Copilot:
github.copilot.chat.otel.captureContent/COPILOT_OTEL_CAPTURE_CONTENT. With it on, prompt messages, response messages, tool arguments, and tool results land on span attributes likegen_ai.input.messagesandgen_ai.tool.call.result. Reference: Content capture. - Claude Code: the
OTEL_LOG_USER_PROMPTS/OTEL_LOG_TOOL_*family.
Anything pasted into chat - file contents, secrets, customer data - rides along when these are enabled.
Sample queries
With the config currently in the OTEL2Sentinel GitHub repo, the interesting stuff shows up in AppTraces:
let since = ago(1h);
AppTraces
| where TimeGenerated > since
| where Message has_any ("tool.call", "agent.turn", "copilot_chat")
| project TimeGenerated, Table="AppTraces", Name=tostring(Message), Properties
| order by TimeGenerated desc
If you add a traces pipeline later, query AppDependencies for execute_tool spans as a second pass.
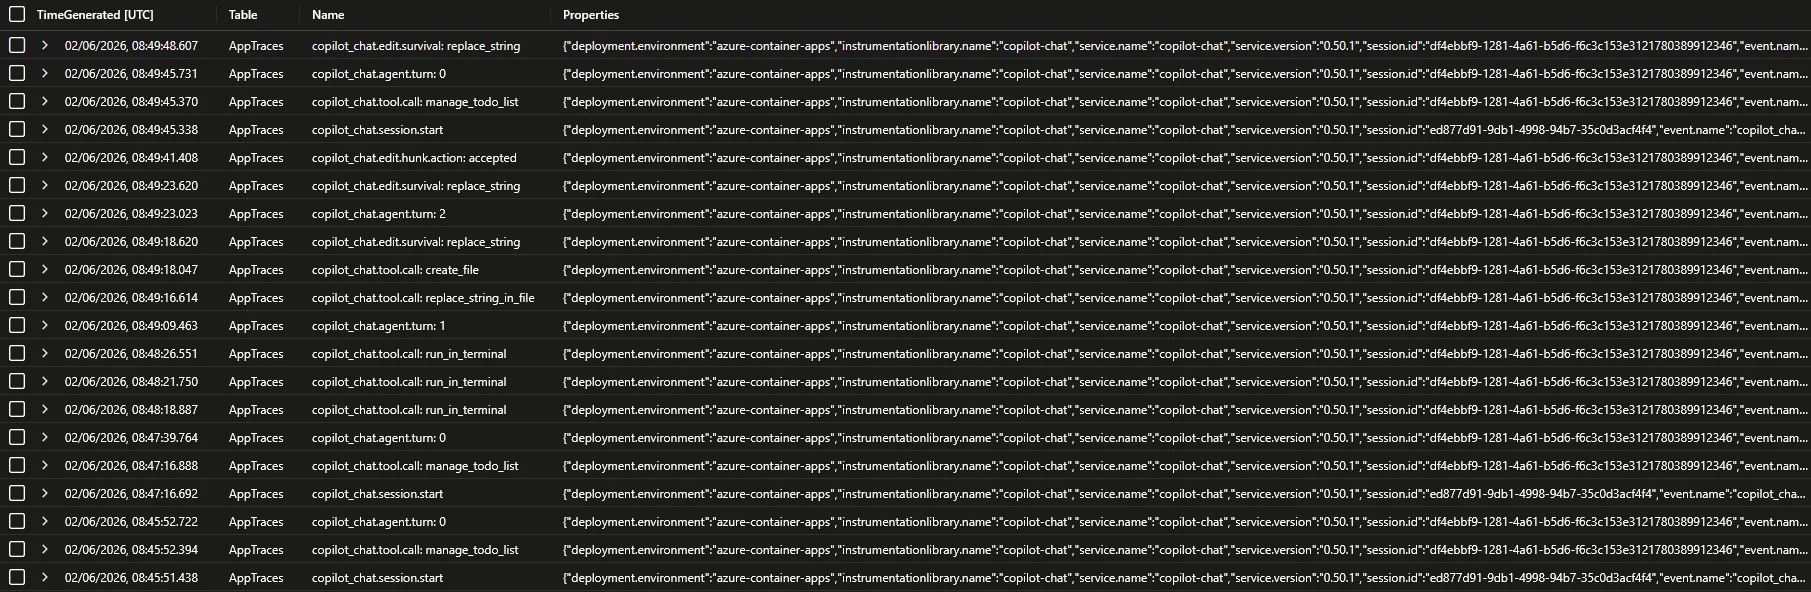
The results from the image doesn’t show anything “spicy”, but it proves the shape. If you enable a traces pipeline and content capture, AppDependencies can carry fields like gen_ai.tool.call.arguments and gen_ai.tool.call.result, plus full prompt/response fields such as gen_ai.input.messages and gen_ai.output.messages. For all the different fields, check out Monitor agent usage with OpenTelemetry.
If your sources also emit traces and metrics, AppRequests, AppMetrics and AppExceptions come into play too. I haven’t really looked at them as they weren’t really relevant to my use case.
Security caveats to consider for production
The repo intentionally optimizes for “stand it up in an afternoon”. Before pointing anything sensitive at it, work through at least these:
- No collector-side auth enforcement. The sources send
Authorization: Bearer <shared-secret>and the secret is stored on the Container App, but the collector config doesn’t include abearertokenauthextension on the OTLP receivers. Anyone who finds the FQDN can write telemetry. Front it with API Management, Front Door, or wire upbearertokenauthon the receivers. - Public ingress, no private networking. External ingress on 4318 is fine for a single-tenant lab, maybe not for production. Who am I to decide? Anyway, you can maybe consider VNet integration and private endpoints.
- ACR admin user is enabled and the password is passed to
az containerapp create/update. Switch to managed-identity pull for anything you care about. - Secrets on the command line. App Insights connection string and the shared bearer secret are passed as PowerShell parameters. Source them from Key Vault or a secrets manager instead, and remember that with content capture on, anything you paste into chat becomes telemetry. The native OTLP path described in the update below removes the connection-string concern entirely by using a managed identity against the DCR.
This is one way
Worth saying explicitly and repeating from the intro: a Collector in Container Apps is not the only path. Reasonable alternatives:
- Direct SDK export to Application Insights via the Azure Monitor OpenTelemetry Distro, skipping the collector entirely.
- Collector somewhere else - AKS, a VM, or even a local sidecar - using the same
azuremonitorexporter. - Different backend - any OTLP-compatible store (Grafana stack, Datadog, Honeycomb) by swapping the exporter.

Update: Microsoft’s native OTLP path
Microsoft has now published both a techcommunity announcement and a Learn doc for first-class OTLP ingestion into Azure Monitor. The collector now ships OTLP straight to a Data Collection Endpoint backed by a Data Collection Rule, authenticated with Microsoft Entra via the Azure Authentication extension. The easiest setup is creating an Application Insights resource with OTLP support: On, which auto-provisions the DCE and DCR and exposes the endpoint URLs on the resource overview page.
What changes versus the pipeline above:
- Exporter swaps from
azuremonitor(App Insights ingestion API + connection string) tootlp_http/azuremonitorposting to the DCE. - Auth swaps from a connection-string secret to Entra. The collector’s identity needs Monitoring Metrics Publisher on the DCR.
- Data lands in OTel-semantic streams (
Microsoft-OTLP-Logs,Microsoft-OTLP-Traces) rather thanAppTraces/AppDependencies, so the KQL above does not port 1:1. - App Insights gets a curated AI agents view, and Azure Managed Grafana ships pre-built coding-agent dashboards (feature usage, commit counts, acceptance rates).
- Collector version: 0.132.0+ for the extension, 0.148.0+ for the
managed_identity: {}syntax shown below. - Metrics must be delta temporality with exponential histograms; add the
cumulativetodeltaprocessor if your SDKs emit cumulative. - If you use App Insights with OTLP support: On, copy the logs/traces/metrics endpoint URLs exactly as shown in OTLP Connection Info. Don’t reconstruct the metrics stream name by hand.
- The source-to-collector leg is unchanged. The public-ingress bearer-token gap is not addressed by this path either.
With a system-assigned managed identity on the Container App, the setup is three steps:
- Enable managed identity:
az containerapp identity assign --system-assigned --name <app> --resource-group <rg>and capture the principal ID. - Grant role on the DCR:
az role assignment create --assignee <principalId> --role "Monitoring Metrics Publisher" --scope <dcr-resource-id>. - Replace the exporter and add the auth extension in the collector config.
receivers:
  otlp:
    protocols:
      grpc:
        endpoint: 0.0.0.0:4317
      http:
        endpoint: 0.0.0.0:4318

processors:
  memory_limiter:
    check_interval: 1s
    limit_mib: 512
    spike_limit_mib: 128
  batch:
    send_batch_size: 1024
    timeout: 5s

extensions:
  azure_auth:
    managed_identity: {}
    scopes:
      - https://monitor.azure.com/.default

exporters:
  otlp_http/azuremonitor:
    # Copy these exact URLs from App Insights > Overview > OTLP Connection Info,
    # or construct them exactly from your DCR/DCE if you used the manual path.
    logs_endpoint: "https://<exact-logs-endpoint>"
    traces_endpoint: "https://<exact-traces-endpoint>"
    metrics_endpoint: "https://<exact-metrics-endpoint>"
    auth:
      authenticator: azure_auth

service:
  extensions: [azure_auth]
  pipelines:
    logs:
      receivers: [otlp]
      processors: [memory_limiter, batch]
      exporters: [otlp_http/azuremonitor]
    traces:
      receivers: [otlp]
      processors: [memory_limiter, batch]
      exporters: [otlp_http/azuremonitor]
    metrics:
      receivers: [otlp]
      processors: [memory_limiter, batch]
      exporters: [otlp_http/azuremonitor]
The APPLICATIONINSIGHTS_CONNECTION_STRING Container App secret is no longer needed on this path. The OTEL2Sentinel repo will get a side-by-side collector-msft / infra-msft variant for this configuration rather than replacing the existing one.
Final thoughts
If you enable this, it’s a lot of data. If you enable content, it’s a ton of data that also contains a ton of data not everyone should have access to. Yes, it’s important to control AI, but make sure you can filter or pick up things like people dropping production grade secrets into the chat.
Full deploy scripts, source templates, and per-agent docs:
If you spin it up and find rough edges, issues and PRs are welcome.