Log Horizon tutorial: How to improve Microsoft Sentinel posture

So it’s been a few weeks since I first released Log Horizon and I wanted to take some time to actually run through all the features and what they are used for. This tutorial guides you through the entire function and what it can do for you.
I made a few updates while writing this blogpost, so if you haven’t updated to version 0.7.0 yet, the time is now. You can find Log Horizon on Github.
Getting started
Installing Log Horizon
Install-Module -Name Az.Accounts, Az.OperationalInsights, Az.SecurityInsights, PwshSpectreConsole -Scope CurrentUser

git clone https://github.com/lnfernux/log-horizon
Import-Module ./log-horizon/LogHorizon.psd1
Parameters
Log Horizon takes a few parameters as input. Some are required, while most are not. This table outlines what each parameter does and what input it takes.
| Parameter | Type | Required | Default | Description |
|---|---|---|---|---|
-SubscriptionId | string | Yes | - | Azure subscription ID |
-ResourceGroup | string | Yes | - | Resource group containing the Sentinel workspace |
-WorkspaceName | string | Yes | - | Log Analytics workspace name |
-WorkspaceId | string | No | - | Workspace ID (auto-resolved if omitted) |
-Output | string | No | - | Export format: json, markdown / md, or html |
-OutputPath | string | No | - | File or directory path for export (auto-generates timestamped filename when a directory) |
-Keywords | string[] | No | - | Keywords for gap analysis (e.g. 'AWS','CrowdStrike') |
-IncludeDefenderXDR | switch | No | - | Include Defender XDR custom detection analysis |
-IncludeDetectionAnalyzer | switch | No | - | Include per-rule noisy detection analysis using incidents and automation rules |
-DetectionLookbackDays | int | No | 90 | Query window for incident/automation-based detection analysis (1-365 days) |
-DaysBack | int | No | 90 | Query window for usage data (1-365 days) |
-PricePerGB | decimal | No | 5.59 | Sentinel ingestion price per GB |
-NonInteractive | switch | No | - | Skip the TUI dashboard and export directly (or return data to pipeline if -Output is omitted) |
-CustomClassificationPath | string | No | - | Path to a custom JSON file to add or override classifications |
Running your first scan
To explore Log Horizon via CLI, we can use the following command:
Invoke-LogHorizon -SubscriptionId $subscriptionId -ResourceGroup $resourceGroupName -WorkspaceName $workspaceName -CustomClassificationPath .\Data\custom-classifications-example.json -Keywords custom -DetectionLookbackDays 90 -IncludeDetectionAnalyzer -IncludeDefenderXDRIn addition to the required commands, I have a custom classification file custom-classifications-example.json that will override the baseline log-classifications.json. This is a feature in Log Horizon that allows you to curate your own baselines if something deviates from the one that comes as default with the tool.
The -Keywords parameter allows you to input words, such as AWS if you know you have AWS in your company but no logs are flowing to Sentinel yet. This is not perfect, but it’s a helpful way to highlight possibly missing data from the log-classifications.json-file, as all json blobs have keywords connected to them. Someting like Firewall might be a tad broad though.
-IncludeDefenderXDR includes data from Defender, such as custom detection rules and the XDR-tables, while -DetectionLookbackDays 90 allows you to override the default 90-days lookback (this command does nothing in this context, since it’s just set to the default value). Last but not least, -IncludeDetectionAnalyzer (which is pretty similar to detection assessment) runs a some more detection analysis for us.
Exploring the CLI
The first thing we will meet is the Log Horizon banner and some high level overview information:
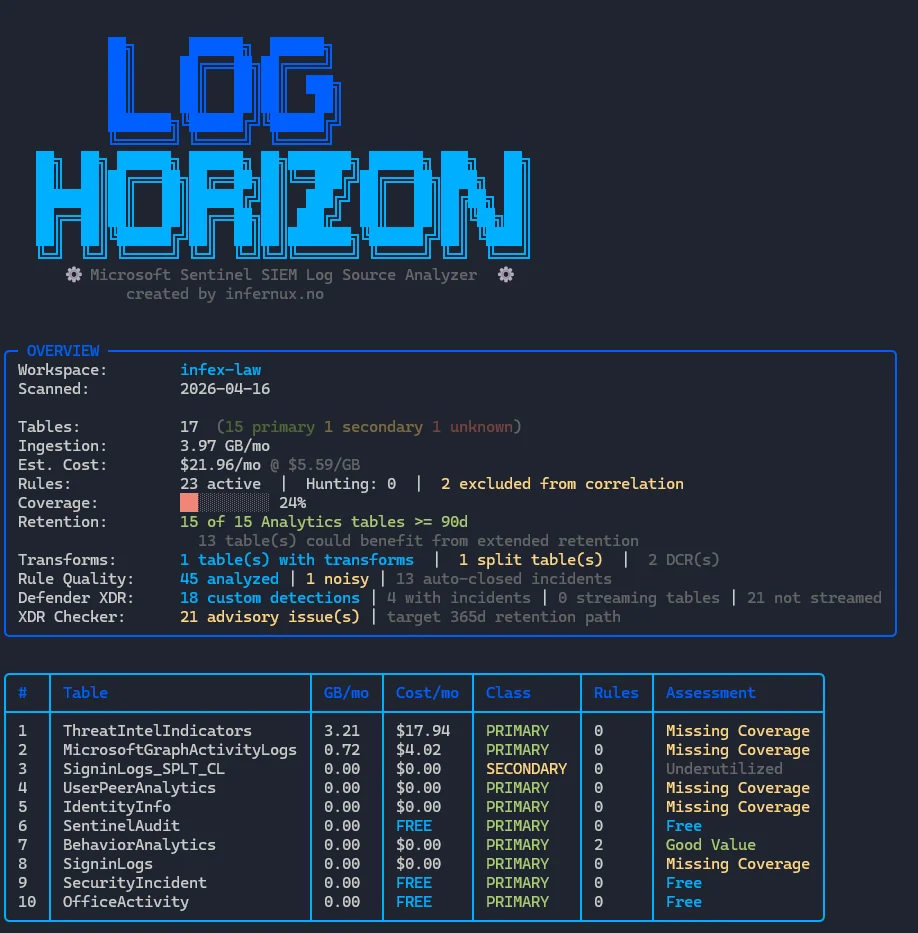
This basically gives us the outline of our workspace and some key stats like:
- Our total tables, classification (primary vs secondary)
- Total ingestion and ingestion cost
- Number of rules, numer of rules without correlation enabled
- Coverage (calculated based on number of tables covered by at least one rule)
- If
-IncludeDefenderXDRis enabled this also includes XDR-tables and Custom Detection Rules
- If
- Transforms (workspace DCR, filters and splits)
- Rule Quality (from
-IncludeDetectionAnalyzer) as a static analysis - Defender XDR summary (from
-IncludeDefenderXDR, shows number of custom rules, XDR-tables information) - XDR Checker is a submodule that is presented as part of the recommendations (we’ll get to this later)
- Top 10 tables by cost - in my example I don’t have enough tables generating cost
Below that, we have the menu:
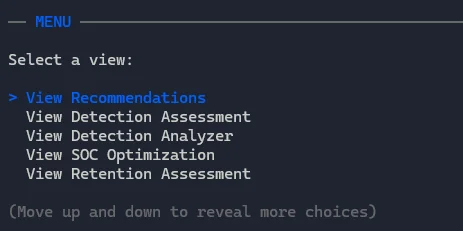
In total we have the following options to choose from:
| # | Menu Item | Description |
|---|---|---|
| 1 | View Recommendations | Top actionable optimization recommendations sorted by priority, with savings estimates |
| 2 | View Detection Assessment | Per-table cost-value matrix showing classification, rule coverage, and assessment scores |
| 3 | View Detection Analyzer | Noisiness scoring for analytics/CDR rules — incident volume, auto-close %, false positive %, detection coverage bars |
| 4 | View SOC Optimization | SOC improvement recommendations pulled from the Sentinel Security Insights API |
| 5 | View Retention Assessment | Per-table retention days, archive periods, table plan type, and compliance status |
| 6 | View Data Transforms | DCR transform inventory showing which tables have ingestion-time transforms applied |
| 7 | Log Tuning / Transforms | Sub-menu with split KQL generation, live tuning KQL (filter/project/combined), and field-by-rule breakdowns |
| 8 | View All Tables | Full table listing ranked by cost — columns adapt to width (Hunting, Retention shown at wider widths) |
| 9 | Export Report | Export to JSON, Markdown, or HTML file |
| 10 | Quit | Exit the interactive TUI |
Let’s explore each one of those.
View Recommendations
The recommendations are a summary of recommendations based on the tools output. It’s made to highlight tables with missing detections, noisy detections and missing retention among other things. As more features are added to Log Horizon, this will only enhance this view.
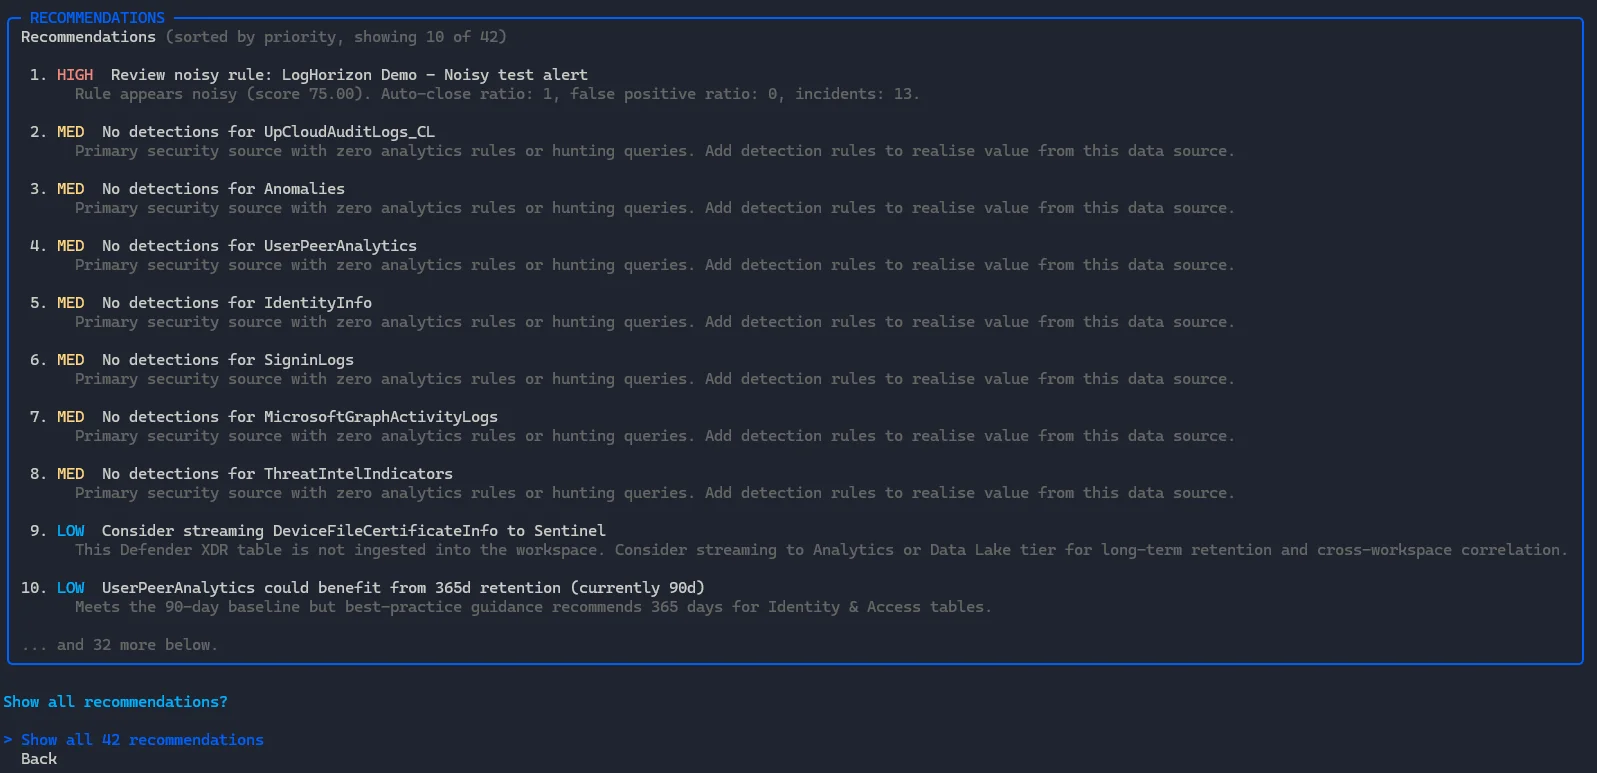
We also have the option to show more than just top 10, if we want to view all of them. Not all recommendations will be good ideas for everyone, so take it with a healthy dose of salty grains.
View Detection Assessment
Currently this menu displays a summarized detection assessment that highlights:
- Good configuration
- Gaps (log sources with few detections)
- Primary log sources with 0 detections
- If you have provided custom classifications and one of those tables are not ingesting, it will highlight this
- Shows rules excluded from correlation
This also has a submenu that allows us to explore tables more in depth.
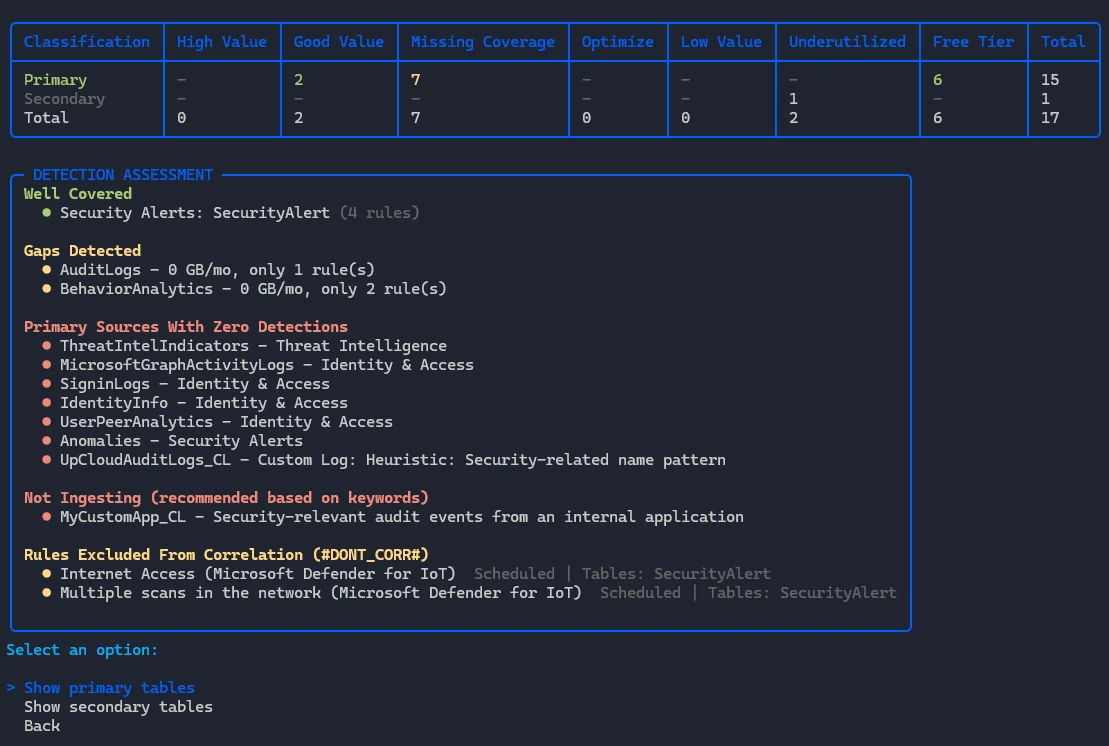
The submenus allow you to explore the tables highlighted in the top matrix:
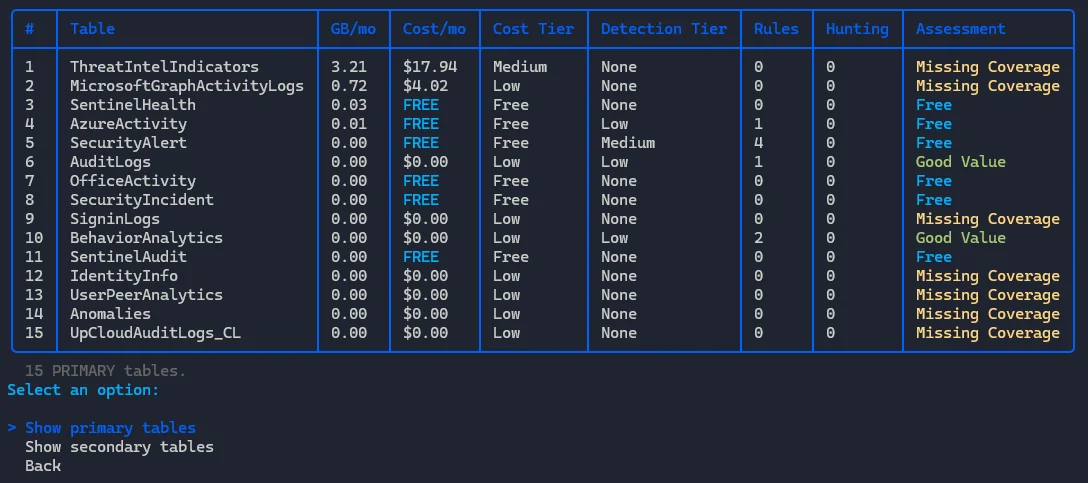
Basically shows which tables are missing coverage (detection), which ones have good value (cost money but have detections) and then free logs. In the future free logs will probably also show as missing vcoverage if that is the case, but not all free logs should have detections so still working that out.
View Detection Analyzer
Gives us an overview of our detection coverage, such as how many of our tables are covered by detection rules, either analytics rules or custom detection rules (if they reference Sentinel rules). It also shows hunting queries.
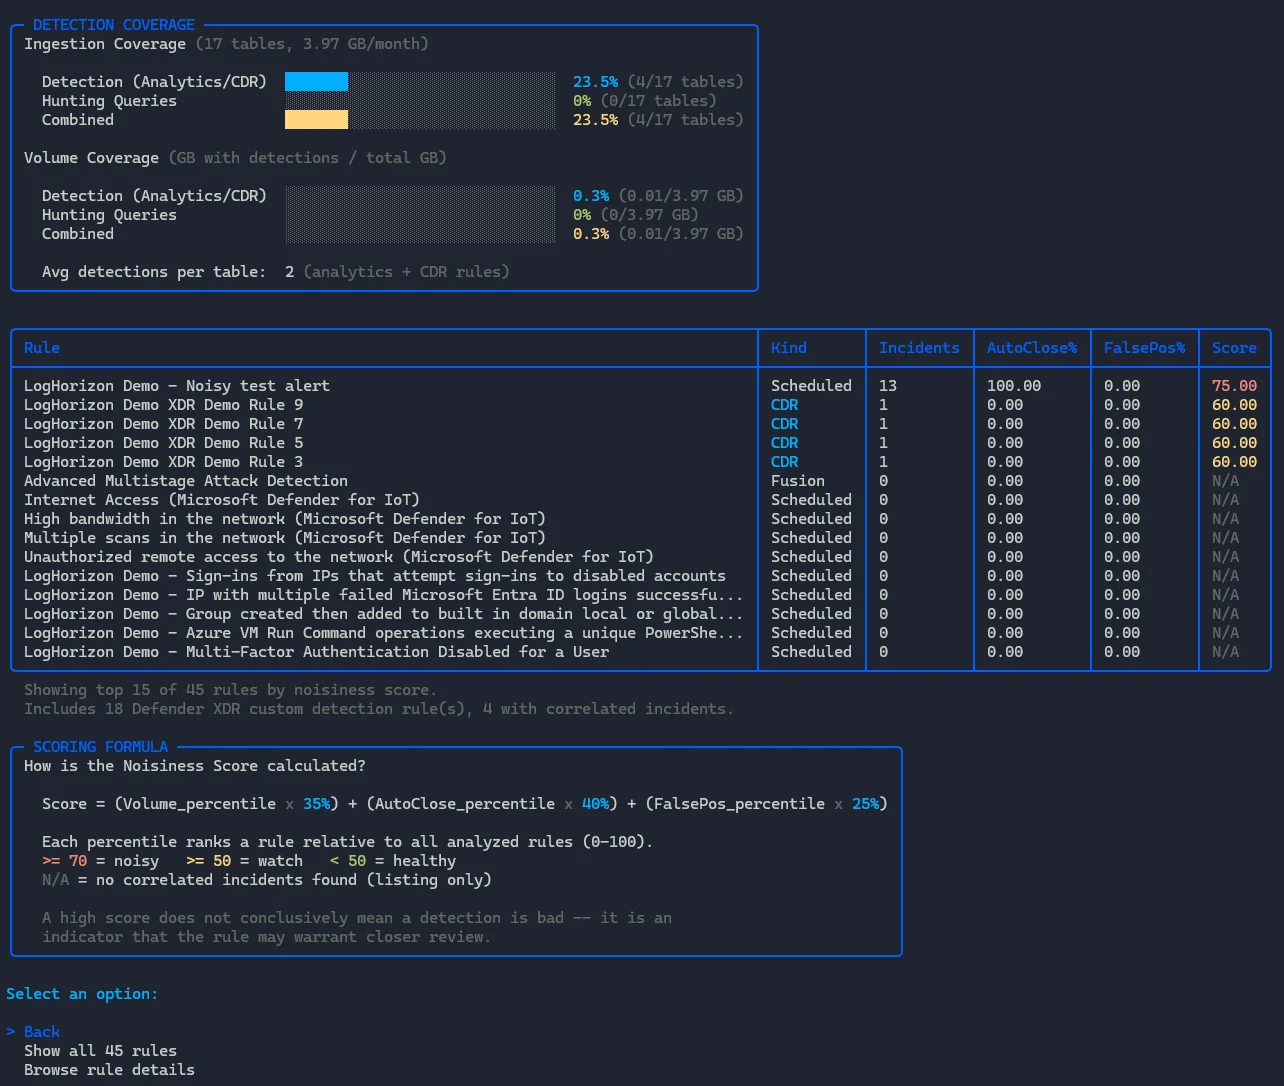
The idea is simply to show an overview of the coverage and give some key stats, such as:
- How many tables are covered by detection rules (in %)
- Same for hunting queries, and combined
- How much of your ingested volume is covered by detections (same categorie as 1. and 2.)
It also calculates a noisiness score for each analytic rule or custom detection rule based on the following formula:
Score = (Volume_percentile x 35%) + (AutoClose_percentile x 40%) + (FalsePos_percentile x 25%)Each percentile ranks a rule relative to all analyzed rules (0-100), using the following treshold:
>= 70 = noisy >= 50 = watch < 50 = healthyIn my example I created a query that runs often and is always auto-closed by an automation rule. The demo rules that show up are all scoring high because nothing else is, but this function is not a definitive guide to quality, rather a helpful tool to indicate something might be wrong with a detection.
As the example detection fires quite a lot and is always closed by automation it might warrant a closer look. Is a detection really doing anything if it’s auto-closed each time? Can a closed alert/incident correlate in Defender XDR automatically?
The submenu allows you to explore all the rules, or each rule in more detail.
View SOC Optimization
Maybe the least exiting feature, it pulls the SOC optimization data we can find in Defender XDR/Sentinel 1:1 and displays it.
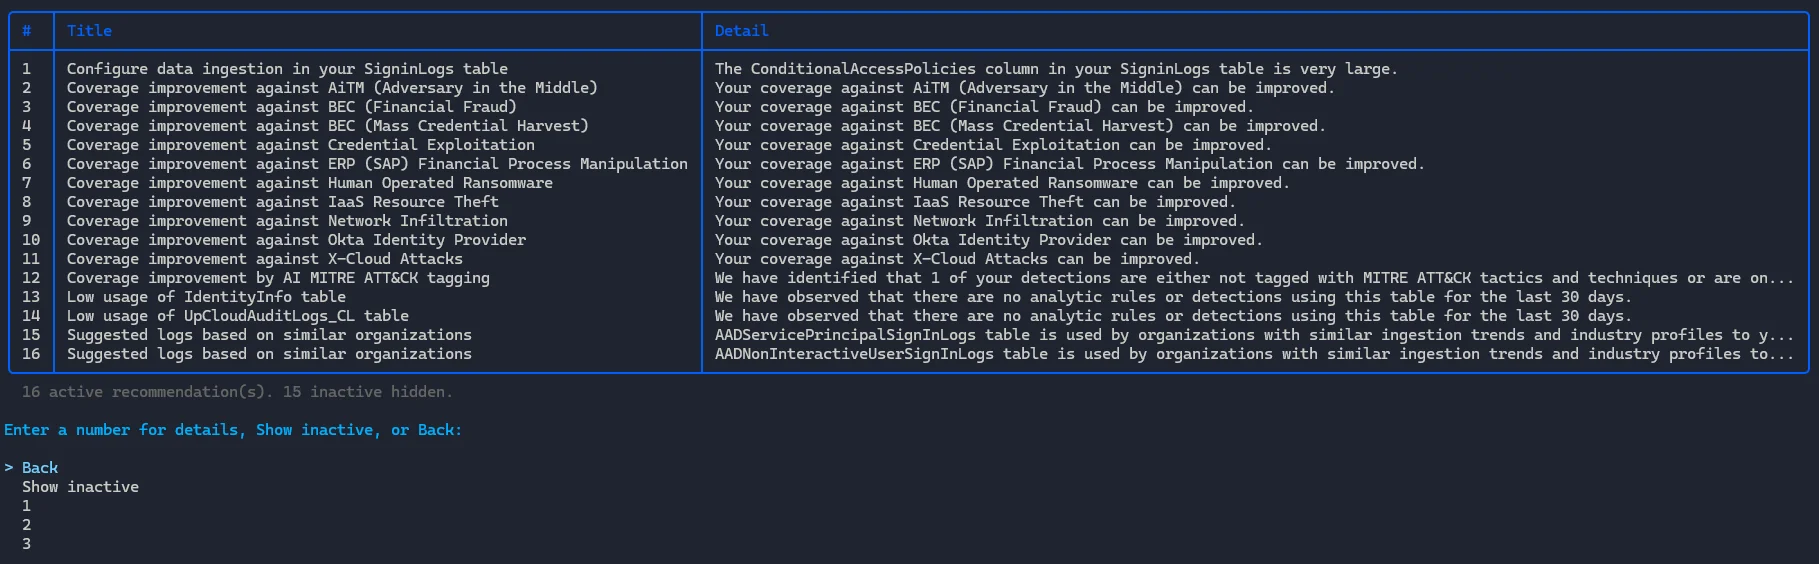
It shows active recommendations, but also allows you to explore each one in detail or view inactive ones.
View Retention Assessment
This feature flags if you have retention under the default included 90 days.
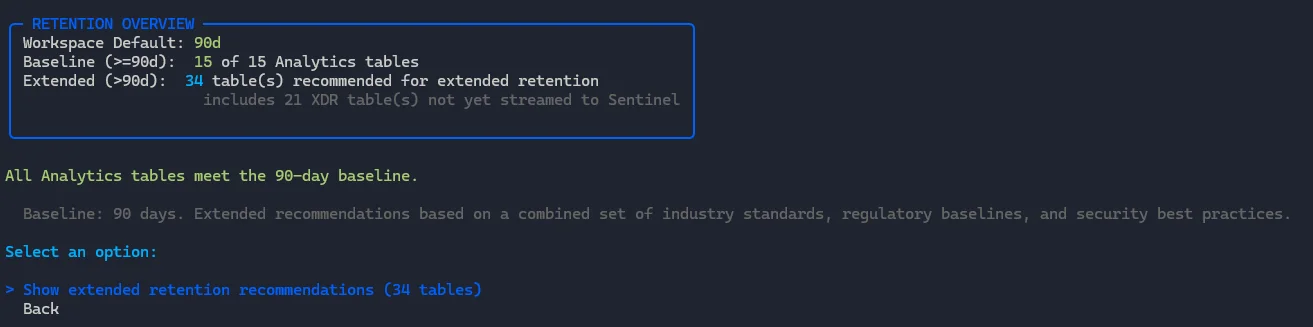
It also takes into account the recommendations from the log-classifications.json-file and allows you to display extended recommendations that includes retention recommendations above the 90 day baseline (mainly in data lake) and XDR-streaming.
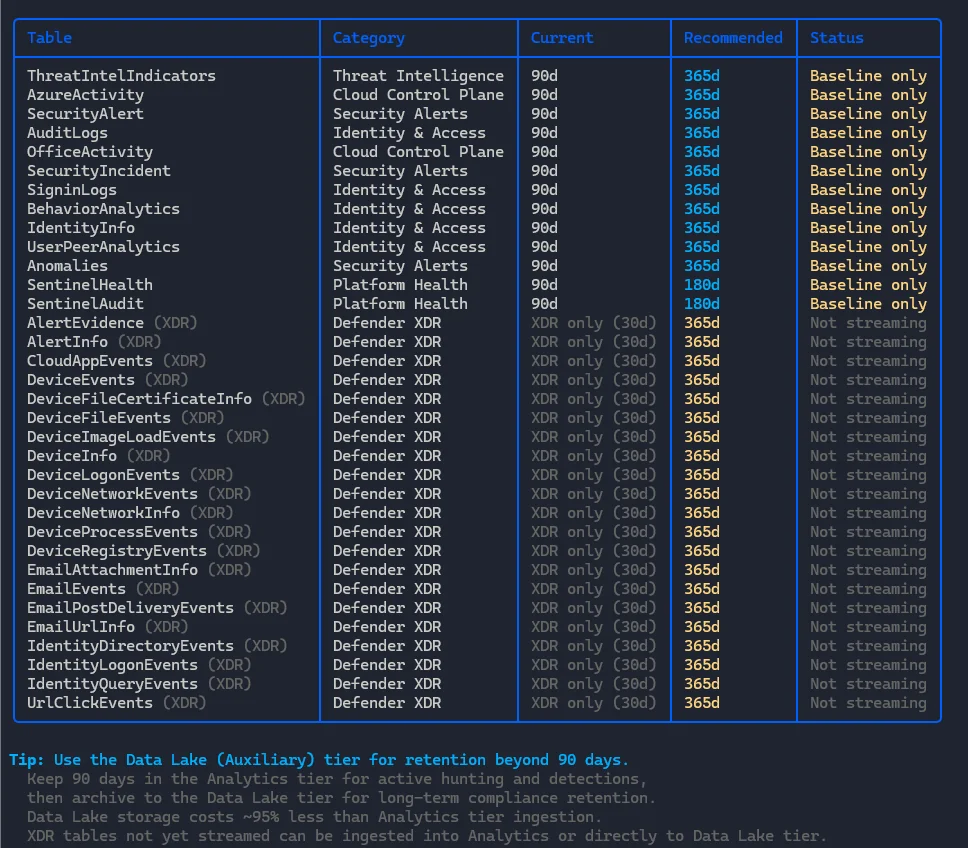
It doesn’t offer any configuration guidance yet.
View Data Transforms
This basically shows you the number of data collection rules (DCRs) with transforms, which tables have transforms applied to the and which tables are split (using the new split rules feature).
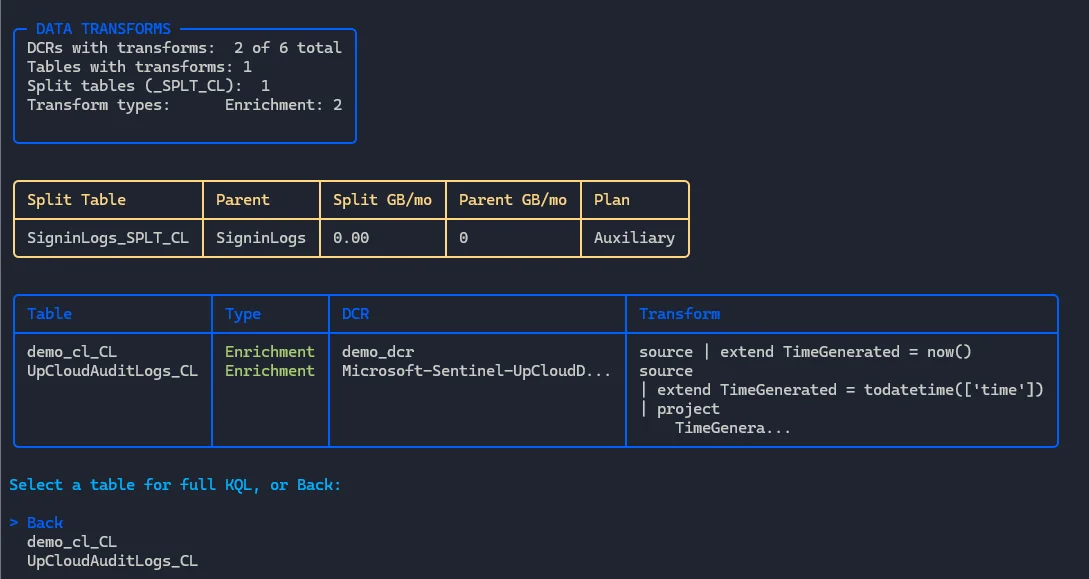
It also shows the split tables, the DCRs themselves and allows you to explore each transform in more detail.
Log Tuning / Transforms
Maybe the most experimental feature, this log tuning guide helps you with log tuning suggestions. It’s based on two files, high-value-fields.json and field-frequency-stats.json.
The high value fields file basically is an analysis of which analytic rules and detection rules that query the table most often use, and the field frequency stats is a summary of detection rules and analytic rules but aggregated on categories. It’s not a perfect approach and the baselines need more work for sure.
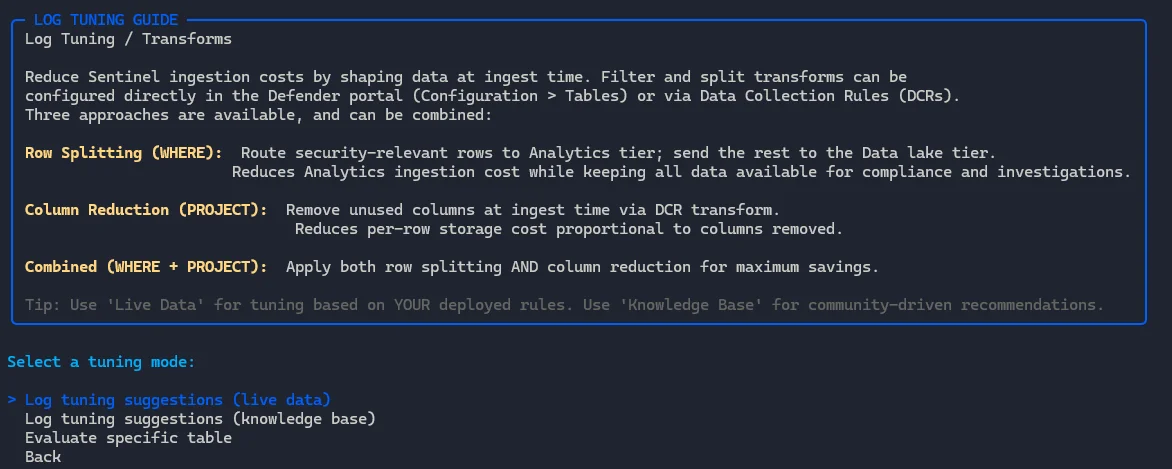
The first mode is live, which instead of using the above files actually takes into account the data you are currently using for detection.
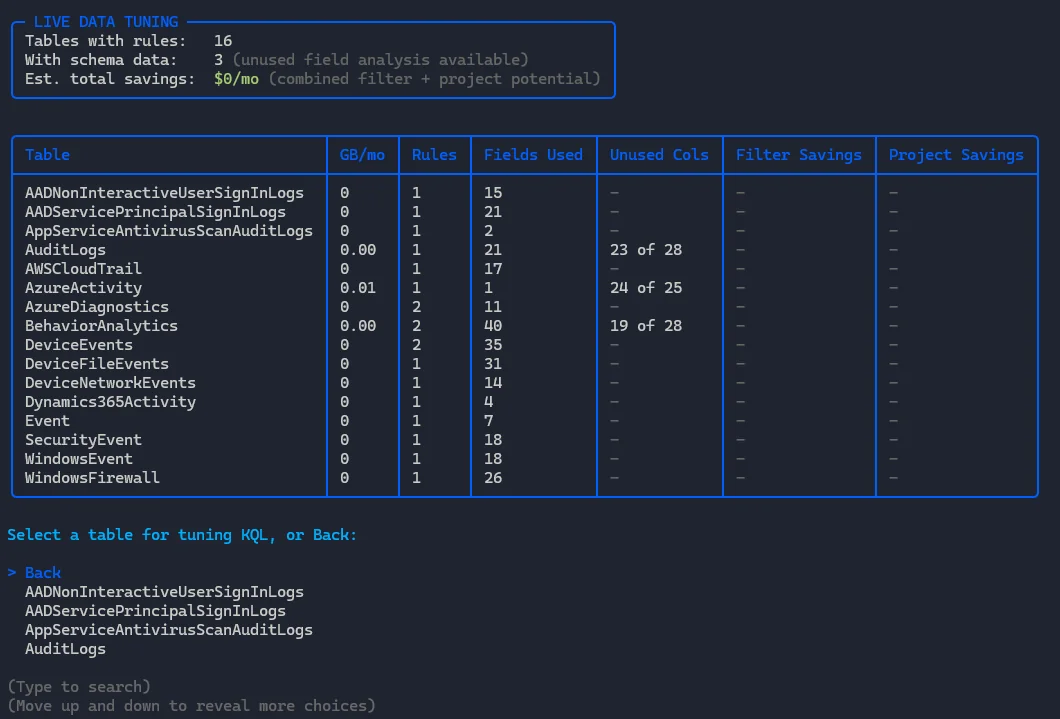
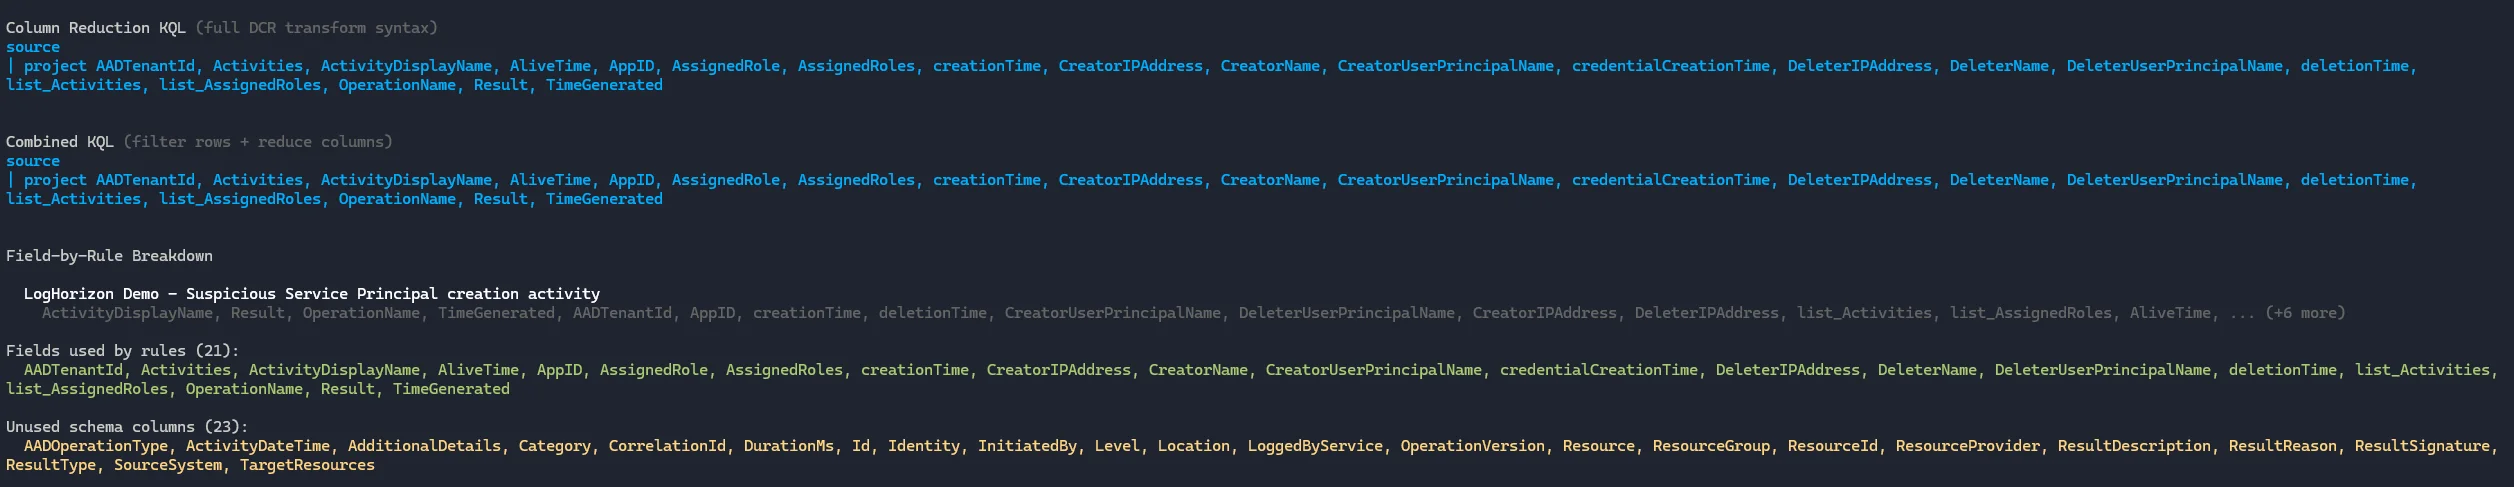
From here we can dive into a specific table, like AuditLogs and this allows us to perform the three actions from the menu:
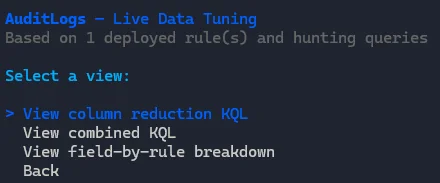
Each of them done in sequence looks something like this:
The live tuning mode is not recommended for new Microsoft Sentinel deployments, or fresh SOCs. Your rule coverage will likely (hopefully, please) be limited to a few but high quality rules and thus this tuning could remove important data for detections you want to create in the future.
The log tuning suggestions (knowledge base) uses the aforementioned files if the log source is high-volume, primary, has detections and no existing transforms. In my env this does not apply, so no output is produced.
We can explore each table in detail from the menu also, like AuditLogs:
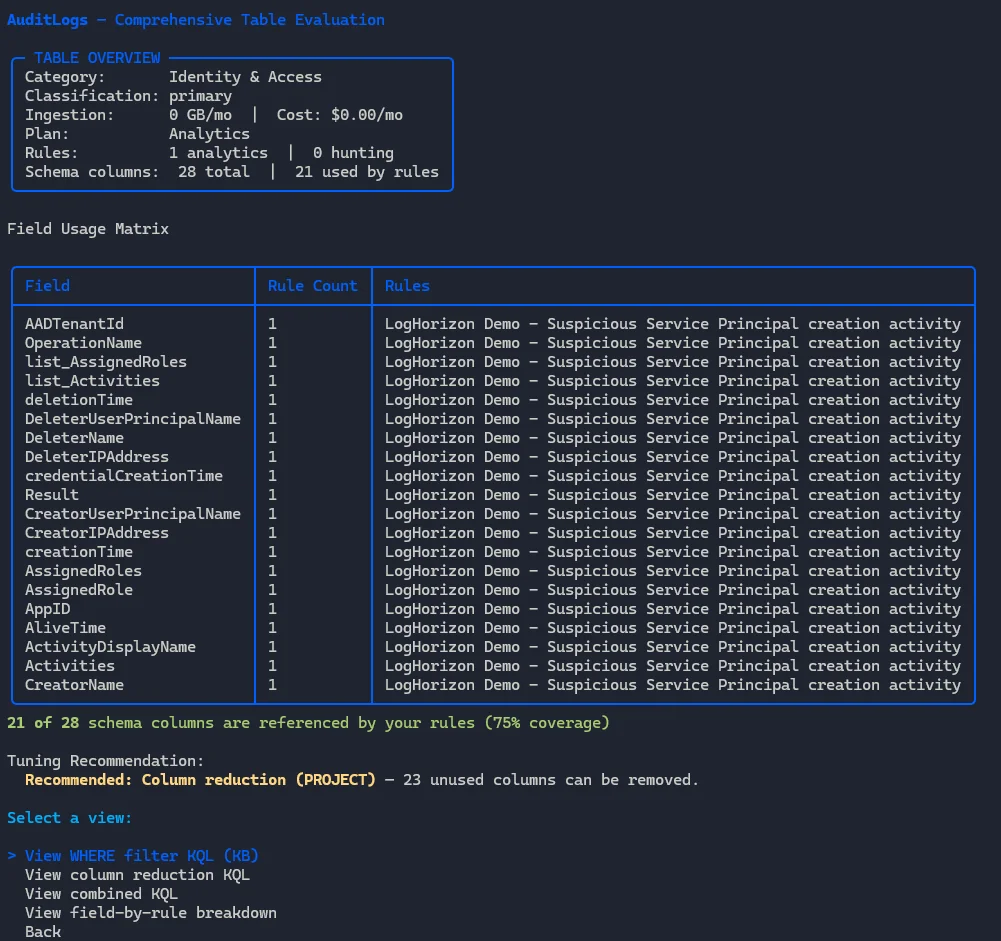
This again just shows a more detailed breakdown of the log and which fields are used.
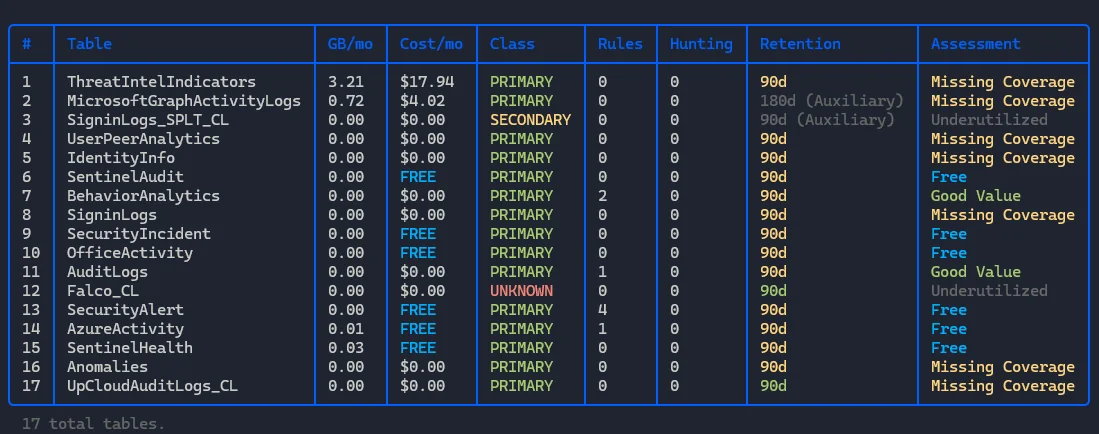
View All Tables
This lists all tables in your Microsoft Sentinel workspace (similar to the table in detection assessment, combined into one):
That’s all.
Export Report
This allows you to output the data from Log Horizon to either markdown, HTML or JSON.
Links
- Repository: github.com/lnfernux/log-horizon