Microsoft Sentinel Cost Estimation with the Sentinel Cost Estimator
Microsoft published the new Sentinel Cost Estimator a little while back, which adds Sentinel-specific inputs such as Analytics tier, Data Lake placement, retention, query volume, and notebook usage.
The workflow for cost estimation in 2026 is of course still largely the same as it was when I wrote the original version of this article in 2023: start with actual ingestion where you have it, estimate table placement before rollout, and treat the calculator output as planning input rather than a final number.
Quick info
- The Sentinel Cost Estimator is now the most practical starting point for Sentinel-specific estimates.
- It can model up to three years of growth.
- It models Analytics tier, Data Lake placement, retention, older-data queries, and notebook usage.
- The Azure Pricing Calculator is still useful when you need the broader Azure estate in the same estimate.
- The estimate still depends on your ingestion, licensing, entitlement, and retention choices.
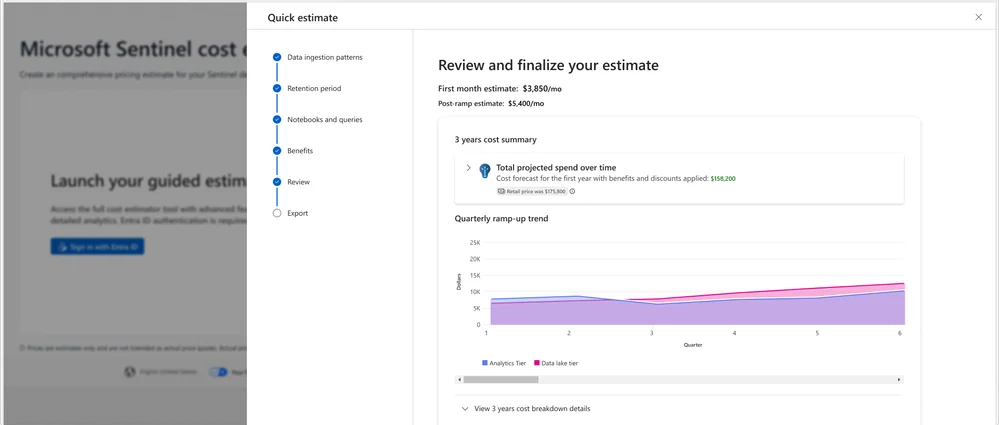 The new Microsoft Sentinel Cost Estimator view.
What changed
Cost estimation used to be a mix or combination of workspace ingestion measurements, EPS, connector assumptions, and then heading over to the Azure Pricing Calculator. The new estimator now models growth over time, Analytics tier versus Data Lake placement, retention, older-data query volume, notebook and advanced data insights usage, eligible free ingestion scenarios, and it ends in a review step you can export for planning conversations.
It’s a bit more involved (which I reckon is good), but you can of course still do it all manually if you so prefer.
Before you estimate
You still need roughly the same inputs as before:
| Input | Why it affects the estimate | Typical source |
|---|---|---|
| Daily billable ingestion | Sets the base volume you are costing | Usage, a similar deployment, or vendor sizing |
| Analytics tier tables | Determines how much data stays in the premium path | Detection content, hunting needs, and triage requirements |
| Retention period | Changes storage cost over time | Compliance, IR, and internal policy |
| Older-data query activity | Changes the cost of working with retained data | Hunting patterns, investigations, and reporting |
| Notebook or advanced data insights usage | Adds compute-oriented usage to the model | Planned analyst or data science workflows |
| Eligible free ingestion | Can reduce the effective estimate materially | Microsoft 365, Defender, and bundled data entitlements |
If you have not already separated primary from secondary data, do that first. I go deeper on that in Building a practical log baseline. If your retention story now includes Microsoft Sentinel Data Lake, read this first. It covers where those tradeoffs start to make financial sense to a certain degree (almost always).
Practical workflow
The workflow I would use now looks roughly like this:
%%{init: {"theme": "base", "themeVariables": {"fontFamily": "Trebuchet MS, Segoe UI, sans-serif", "primaryColor": "#eaf3ff", "primaryBorderColor": "#2b6cb0", "primaryTextColor": "#8d94a3", "lineColor": "#334155", "tertiaryColor": "#f8fafc"}}}%%
graph TD
	A[Measure or estimate daily billable GB] --> B{Needed for live detection or fast triage?}
	B -- Yes --> C[Keep the table in Analytics tier]
	B -- No --> D[Send to Data Lake tier]
	C --> E[Set retention based on requirement]
	D --> E
	E --> F[Add older-data query and notebook usage]
	F --> G[Factor in free ingestion and entitlements]
	G --> H[Compare likely and growth scenarios]

	classDef decision fill:#fff7ed,stroke:#c2410c,stroke-width:2px,color:#7c2d12;
	classDef step fill:#e0f2fe,stroke:#0369a1,stroke-width:2px,color:#0c4a6e;

	class B decision;
	class A,C,D,E,F,G,H step;
In the Microsoft post, the query and notebook options are modeling inputs. They are there to represent expected usage, not to lock you into fixed consumption up front.
If you already know the data source
Same connector, similar environment
If you already ingest the same connector elsewhere, start there.
If one environment ingests 10 GB/day for 100 relevant users, that is a reasonable first pass for a user-driven source:
10 GB/day / 100 users = 0.1 GB/day per user
40 users x 0.1 GB/day = 4 GB/day
The number will not be exact, but it is usually better than starting from zero.
Similar connector, similar logging behavior
If you have not onboarded that exact product, but you have onboarded something operationally similar, use that as a first pass.
Firewall-to-firewall, VPN-to-VPN, EDR-to-EDR, or SaaS audit-to-SaaS audit comparisons can be useful if:
- The logging verbosity is similar.
- The user or endpoint population is similar.
- The policies are similar.
- The detection goals are similar.
EPS or vendor sizing
If the vendor gives you EPS, or you already have the data in another SIEM or syslog pipeline, convert it to daily volume and treat it as a starting number, not a final answer.
If you do not know, measure
When the source is new, measuring is usually the only sensible answer.
- Onboard the data source.
- Let it run for at least 7 days; 30 is better if the source is bursty or business-driven.
- Watch for weekend changes, monthly spikes, and noisy one-off events.
- Feed the measured number into the estimator.
A basic daily trend query still helps:
Usage
| where StartTime >= startofday(ago(7d)) and EndTime < startofday(now())
| where IsBillable == true
| summarize BillableDataGB = sum(Quantity) / 1000. by bin(StartTime, 1d), DataType
| order by StartTime asc
And if you want total billable volume for one table over the same period:
Usage
| where StartTime >= startofday(ago(7d)) and EndTime < startofday(now())
| where IsBillable == true
| where DataType == "YourDataType"
| summarize BillableDataGB = sum(Quantity) / 1000. by DataType
If you are already working with different table plans in the workspace, the new Plan field in Usage also makes it easier to split observed ingestion before you estimate. I covered that separately in Plan types now show up in the Usage table.
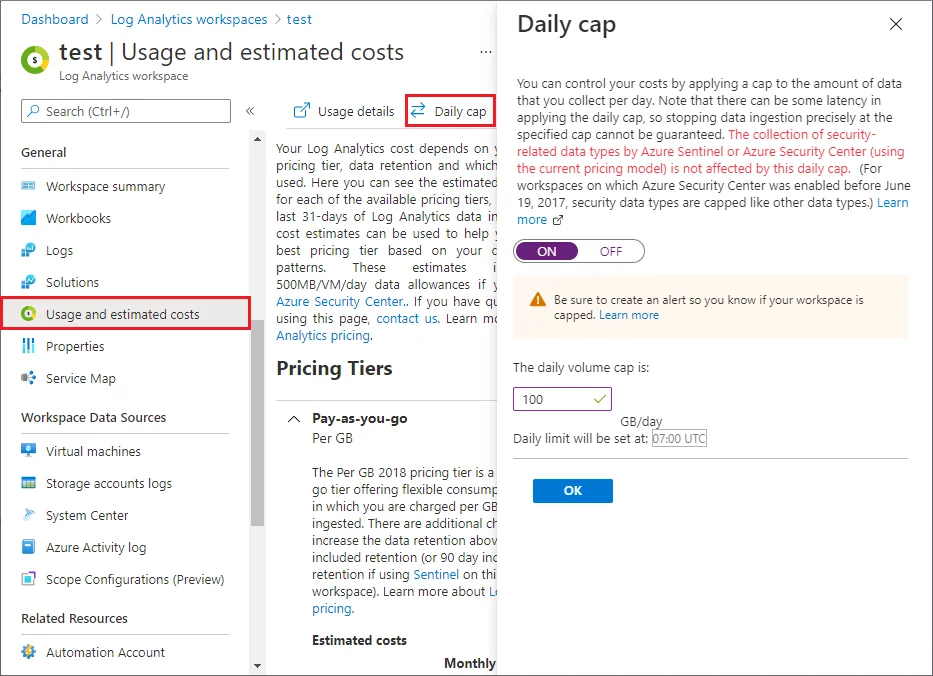
If you are worried about accidentally discovering a very expensive truth, set a daily cap in Log Analytics before you onboard something noisy.
Cost controls before rollout
Tier by detection value, not by habit
Not every table belongs in Analytics tier.
 Remember that even if you send data to Analytics tier, you can choose to keep data in data lake after the analytics period is over.
If the data is required for live detection, frequent hunting, or fast triage, keep it in Analytics tier. If it is mostly long-tail context, compliance depth, or occasional historical lookup, model it in Data Lake instead. That is the same primary-versus-secondary split I wrote about in Building a practical log baseline.
Filter fields you are paying for and not using
This is one of the easier ways to reduce the estimate before production.
In Workspace Transformation Rules in Practice, I walked through two simple examples:
- Dropping
ConditionalAccessPoliciesfromAADNonInteractiveUserSignInLogswhen it is not needed. - Dropping raw XML
EventDatafromSecurityEventwhen you are effectively storing duplicate content.
Both reduce stored volume without changing much operationally if those fields are not part of detection or triage.
Reduce Windows Security Event volume
If Windows event collection is part of the estimate, do not default to collecting every SecurityEvent.
In Creating smart Data Collection Rules by parsing EventIDs from Analytic Rules, I used active detections as the starting point for collection logic. That is not the right pattern for every team, especially now that filtering and splitting in Defender portal is better than it used to be, but it is still a good way to reduce event volume deliberately instead of by guesswork.
What Microsoft’s example includes
| Assumption area | Example input |
|---|---|
| Ingestion | About 2 TB/day |
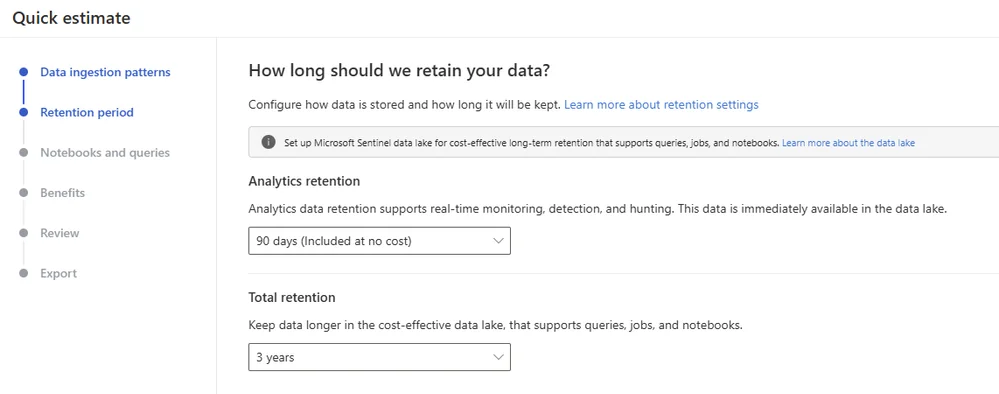
| Retention | Three years |
| Active use | Detections and hunting across identity, endpoint, and network sources |
| Reporting | Some dashboarding |
| Advanced analysis | Some notebook usage |
| Historical access | Queries beyond the Analytics-tier retention window |
| Entitlements | Potential E3 to E5 changes and eligible Defender data |
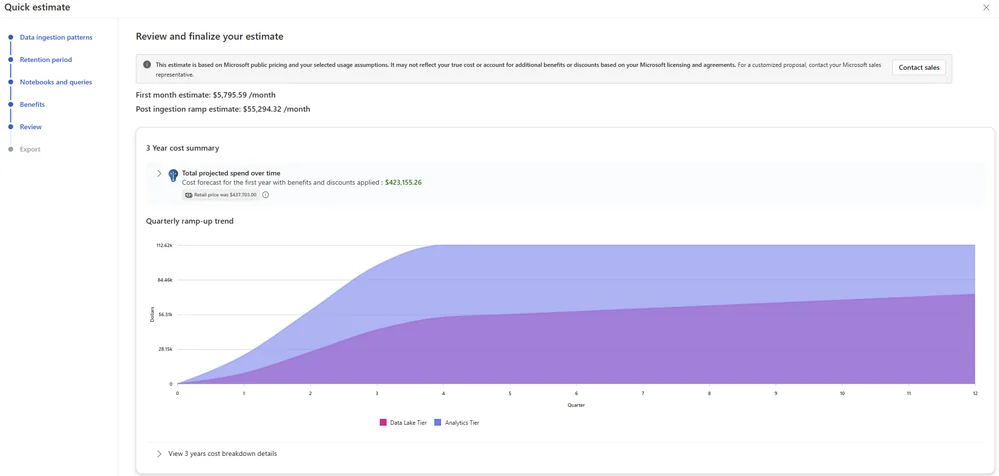
That is closer to a real project estimate than stopping at a single ingestion number.
The review step then projects cost across three years and breaks down the major cost drivers so you can change the architecture, rerun the estimate, and compare the result.
Final thoughts
In practice I would still do this:
- Measure if you can.
- Use the Sentinel Cost Estimator for scenario modeling.
- Decide Analytics versus Data Lake placement based on detection value.
- Strip low-value payload and noisy fields before rollout where possible.
- Re-estimate after filtering, splitting, or tiering decisions.
- Use the exported estimate as planning material, not as a quote.
That gets you to a number you can defend in a design review. Once you have some data to work with, I’d recommend giving Log Horizon, my Microsoft Sentinel SIEM Log Source Analyzer a whirl.
Resources
- Estimate Microsoft Sentinel Costs with Confidence Using the New Sentinel Cost Estimator - Microsoft Tech Community
- Microsoft Sentinel Cost Estimator - Microsoft
- Azure Pricing Calculator - Microsoft
- Manage and monitor costs for Microsoft Sentinel - Microsoft Learn
- Microsoft Sentinel billing - Microsoft Learn
- Microsoft Sentinel Data Lake - FAQ - internal post
- Building a practical log baseline - internal post
- Workspace Transformation Rules in Practice - internal post
- Creating smart Data Collection Rules by parsing EventIDs from Analytic Rules - internal post
- Sentinel Data Lake Cost Calculator by Sandor Tokesi